
- Title
-
Hemato-vascular specification requires arnt1 and arnt2 genes in zebrafish embryos
- Authors
- Edwards, H.E., Edgington, M.J., Souder, J.P., Gorelick, D.A.
- Source
- Full text @ Development
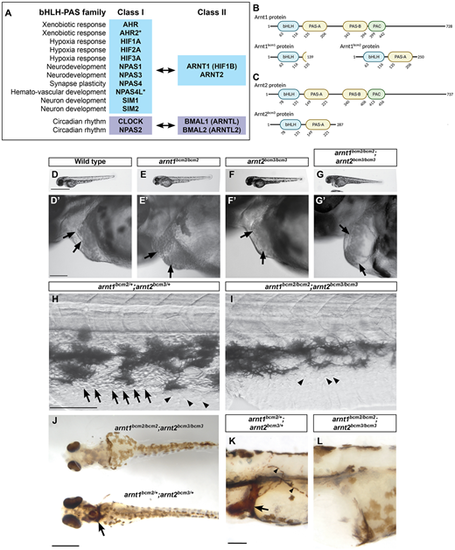
arnt1/2 double mutant embryos, but not arnt1 or arnt2 single mutants, lack circulating blood, have cardiac edema and atrial enlargement. (A) bHLH-PAS transcription factors act as heterodimers: a Class I protein and Class II protein interact and bind DNA. Asterisks indicate proteins encoded by genes present in zebrafish but absent in humans. (B,C) Generation of zebrafish with mutations in arnt1 and arnt2 genes. The amino acid sequences for the zebrafish Arnt1 (B) and Arnt2 (C) proteins are represented by the black line. Basic helix-loop-helix (bHLH), Per-Arnt-Sim (PAS) domains and the motif C-terminally located to the PAS (PAC) are represented by the labeled bubbles. The numbers below each domain indicate the starting and ending amino acid (AA) for each motif. (B) The arnt1bcm1 mutation causes a premature stop codon to occur at AA139 and the loss of the PAS-B, PAC and the majority of the PAS-A. The arnt1bcm2 mutation causes a premature stop codon to occur at AA250 and loss of the PAS-B and PAC domains. (C) The arnt2bcm3 mutation causes a premature stop codon to occur at AA287 and loss of the PAS-B and PAC domains. (D-I) Live images of embryos from the indicated genotype at 2 days post fertilization (dpf). All double homozygous arnt1bcm2/bcm2; arnt2bcm3/bcm3 embryos showed cardiac edema and atrial enlargement (G,G′). The wild-type (D,D′), arnt1bcm2/bcm2 (E,E′) and arnt2bcm3/bcm3 (F,F′) siblings of the double homozygous mutants (arnt1bcm2/bcm2; arnt2bcm3/bcm3) showed normal heart development. Black arrows in D′-G′ indicate the atrium and ventricle of the heart. Images are representative of seven different clutches, each clutch contained 20-300 embryos. All siblings of double homozygous mutants (arnt1bcm2/bcm2; arnt2bcm3/bcm3) had circulating blood (H; Movies 1, 2, 5 and 6) while arnt1/2 mutants lacked visible circulating blood cells (I; Movies 3, 4, 7 and 8). The black arrows in H indicate blood cells. The arrowheads in H and I indicate non-blood cells found in all embryos. (J-L) O-dianisidine staining to label blood cells in embryos 3 days post-fertilization shows that arnt1bcm2/bcm2; arnt2bcm3/bcm3 double homozygous mutants lack blood cells, while all other genotypes have clearly labeled blood cells. The arrows in J and K indicate the duct of Cuvier; the arrowheads in K indicate circulating blood cells. All embryos were derived from arnt1bcm2/+;arnt2bcm3/+ parents; images are representative of one clutch, containing 98 embryos. (J) n=96 of 98 embryos showed clear o-dianisidine staining and none of these embryos was an arnt1/2 mutant. (K) n=2 of 98 embryos showed a lack of o-dianisidine staining and both embryos were confirmed arnt1/2 mutants. For all images, anterior is towards the left and dorsal is towards the top, except for J, which shows a ventral view of the embryos. Scale bars: 1 mm in D-G; 100 μm in D′-G′ and H-L. |
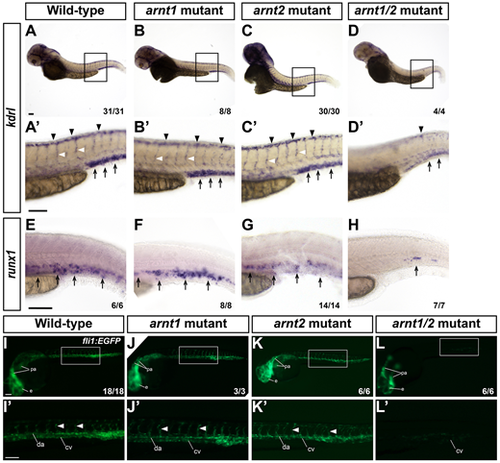
arnt1/2 mutants show reduced levels of endothelial cells and runx1-positive hematopoietic cells. (A-H) Embryos were probed for kdrl (A-D′) or runx1 (E-H) using whole-mount in situ hybridization at 2 days post fertilization (dpf). (A-D) kdrl staining in wild-type, arnt1 mutant, arnt2 mutant and arnt1/2 mutant embryos. (A′-D′) Images of the trunk of each embryo near the end of the yolk extension (outlined in A-D). Black arrowheads indicate kdrl staining in the dorsal longitudinal anastomotic vessels; black arrows indicate the dorsal aorta and caudal vein; white arrowheads indicate inter-segmental vessels. (E-H) Black arrows indicate runx1 labeling in the presumptive hematopoietic stem cell niche. (I-L) Wild-type and mutant embryos on Tg(fli1:EGFP y1) transgenic background were imaged at 1 dpf and then genotyped. (I′-L′) Enlarged images of the trunk of each embryo near the end of the yolk extension (outlined in I-L). White arrowheads correspond to inter-segmental vessels. e, eye; pa, pharyngeal arch; da, dorsal aorta; cv, caudal vein. The fraction in the bottom right corner indicates the number of embryos of the given genotype with the represented phenotype over the total number of embryos of the given genotype from a single clutch. Scale bars: 100 μm. |
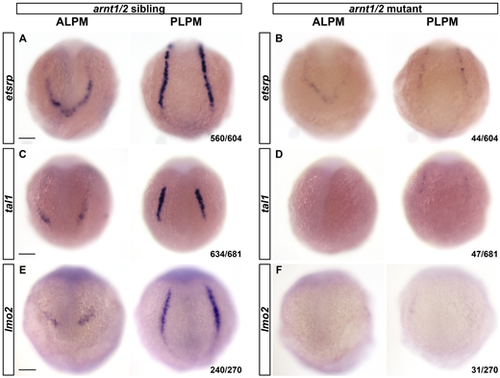
arnt1/2 mutants show decreased etsrp, tal1 and lmo2 expression in the lateral plate mesoderm at the 4- to 6-somite stages. Whole-mount in situ hybridization for etsrp, tal1 and lmo2 expression was performed on 4- to 6-somite stage embryos that were the offspring of an arnt1bcm2/+;arnt2bcm3/+ adult zebrafish. (A) Expression of etsrp was observed in the anterior and posterior lateral plate mesoderm (ALPM and PLPM) in 93% of embryos. (B) Limited or no expression of etsrp was observed in 7% of embryos, consistent with the expected Mendelian ratio of 6.25% for arnt1bcm2/+;arnt2bcm3/+ (arnt1/2 mutants). (C) Expression of tal1 was observed in the ALPM and PLPM in 93% of embryos. (D) Limited or no expression of tal1 was observed in 7% of embryos, consistent with the expected Mendelian ratio of 6.25% for arnt1/2 mutants. (E) Expression of lmo2 was observed in 89% of embryos. (F) Limited or no expression of lmo2 was observed in 11% of embryos, which is slightly more than the expected Mendelian ratio of 6.25% for arnt1/2 mutants. We genotyped a subset of each group of embryos (see Tables S2-S4) and observed a correlation between number of mutant alleles and expression of etsrp, tal1 and lmo2 genes. Spearman correlation, etsrp, r=−0.9, P<0.001; tal1, r=−0.6, P<0.005; lmo2, r=−0.2, P<0.01. All embryos are oriented with dorsal towards the top. Fractions in the bottom right corners refer to the number of embryos with the indicated phenotype over the total number of embryos examined. Scale bars: 100 μm. |
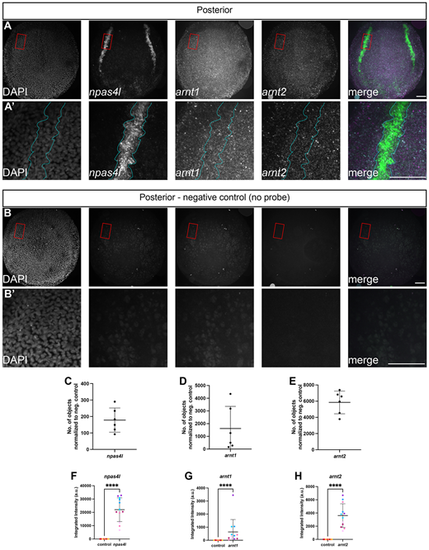
arnt1 and arnt2 are ubiquitously expressed at the 4-somite stage and colocalized with npas4l expression. Whole-mount in situ hybridization chain reaction was performed on wild-type (AB) embryos at the 4-somite stage. (A) Embryos were probed for npas4l, arnt1 and arnt2 expression, and counterstained with DAPI. arnt1 and arnt2 labeling was detected ubiquitously, while npas4l labeling was localized to the lateral plate mesoderm. (A′) Higher magnification views of the areas outlined in A shows colocalization of arnt1, arnt2 and npas4l in the posterior lateral plate mesoderm, outlined in cyan. (B) To demonstrate that the observed expression of arnt1 and arnt2 is not autofluorescence of the embryo or the yolk, wild-type embryos were processed identically to those in A, but no antisense RNA probe sets were added. (B′) Higher magnification views of the areas outlined in B shows what background/autofluorescence looks like in the presumptive posterior lateral plate mesoderm. All images in A and B are maximum intensity projections from z-stacks taken every 2.5 μm. In merged panels, npas4l is green, arnt1 is magenta and arnt2 is cyan. The posterior region of the embryo is in view, dorsal is towards the top of the image. Scale bars: 100 μm. (C-E) To validate the observed expression of arnt1 and arnt2, we quantified the number of detectable objects above a set threshold in the whole embryo across each z-plane for four negative control embryos and six experimental embryos probed for arnt1, arnt2 and npas4l. We then normalized the number of detected objects by subtracting the average number of objects detected in the negative controls from the number of detected objects in the experimental embryos. Each point on these graphs represents the total number of objects above the threshold for a single embryo. (F-H) To demonstrate that arnt1 and arnt2 expression occurs in the lateral plate mesoderm (LPM), we calculated the integrated intensity of fluorescence (pixel area and pixel intensity) over each side of the posterior LPM in maximum intensity projections from control and experimental embryos. Each point represents the integrated intensity from one side of the posterior LPM from a single embryo (right or left side), where each embryo has two bilateral npas4l-positive regions of the posterior LPM. Points of the same color are measurements from opposite sides of the posterior LPM from the same embryo. npas4l, arnt1 and arnt2 labeling was statistically significantly increased in the lateral plate mesoderm compared with negative control embryos. Data are mean±s.e.m. npas4l Welch's t-test, t(11)=8.6, ****P<0.0001; arnt1 Mann–Whitney, U=0, ****P<0.0001; arnt2 Welch's t-test, t(11)=7.0, ****P<0.0001. |
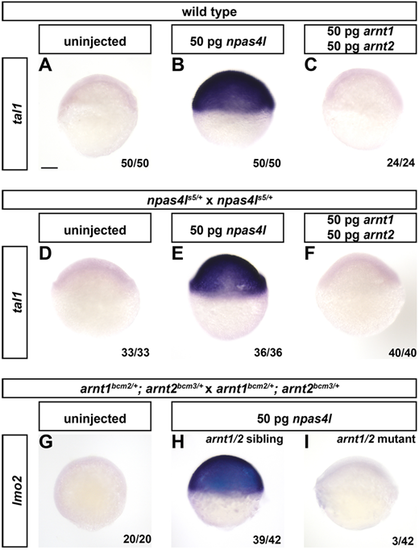
Expression of npas4l-target genes requires npas4l, arnt1 and arnt2. Zebrafish embryos, derived from the indicated parental genotypes, were injected at the one-cell stage with 50 pg of npas4l mRNA or with 50 pg each of arnt1 and arnt2 mRNA (100 pg total RNA). Embryos were fixed at shield stage and probed for tal1 or lmo2 and npas4l-target genes, using whole-mount in situ hybridization. Embryos were then genotyped. (A-C) In wild-type embryos, tal1 is expressed after injection of npas4l RNA. tal1 mRNA was not detected in uninjected embryos or after injection of arnt1 and arnt2 RNA. (D-F) Heterozygous npas4l mutant fish were crossed to each other and the resulting embryos were injected with the indicated RNA. npas4l RNA, but not arnt1 and arnt2 RNA, upregulated expression of tal1. Genotype of embryos in E: n=11 npas4l+/+, n=15 npas4ls5/+ and n=10 npas4ls5/s5. Genotype of embryos in F: n=12 npas4l+/+, n=20 npas4ls5/+ and n=8 npas4ls5/s5. (G-I) arnt1bcm2/+;arnt2bcm3/+ adults were crossed to each other and the resulting embryos were injected with npas4l RNA. Double homozygous embryos failed to upregulate lmo2 (I), whereas sibling embryos upregulated lmo2 (H). Genotype of embryos in H: n=1 arnt1+/+;arnt2+/+, n=7 arnt1bcm2/+;arnt2bcm3/+, n=1 arnt1+/+;arnt2bcm3/+, n=8 arnt1bcm2/+;arnt2+/+, n=4 arnt1+/+;arnt2bcm3/bcm3, n=7 arnt1bcm2/bcm2;arnt2+/+, n=7 arnt1bcm2/+;arnt2bcm3/bcm3 and n=4 arnt1bcm2/bcm2;arnt2bcm3/+. Genotype of embryos in I: n=3 arnt1bcm2/bcm2;arnt2bcm3/bcm3. Embryos are oriented in a lateral view with the animal pole towards the top. Fractions in the bottom right corner indicate the number of embryos with the represented phenotype over the total number of embryos assayed. Scale bar: 100 μm. |
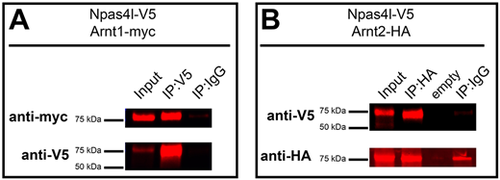
Arnt1 and Arnt2 co-immunoprecipitate with Npas4l. (A) HEK293T cells were transfected with zebrafish Npas4l-V5 and Arnt1-myc. Cells were homogenized (input) and immunoprecipitated (IP) with antibodies against V5 or an immunoglobulin G control (IgG). Samples were run on an immunoblot and probed using myc antibodies (anti-myc) to detect the presence of Arnt1-myc (top) or samples were probed using V5 antibodies (anti-V5) to verify successful pulldown of Npas4l-V5 (bottom). (B) HEK293T cells were transfected with zebrafish Npas4l-V5 and Arnt2-HA. Cells were homogenized and immunoprecipitated with antibodies against HA or an IgG control. Samples were run on an immunoblot and probed using V5 antibodies (anti-V5) to detect the presence of Npas4l-V5 (top) or samples were probed using HA antibodies (anti-HA) to verify successful pulldown of Arnt2-HA (bottom). |
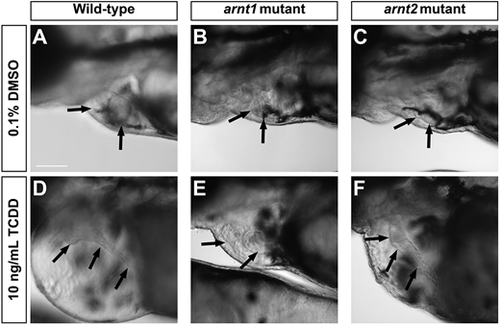
Mutation in arnt1, but not arnt2, prevents AHR2-dependent TCDD toxicity. (A-F) Wild-type or mutant larvae were exposed to (A-C) 0.1% DMSO or (D-F) 2,3,7,8-tetrachlorodibenzodioxin (TCDD) from 1-3 dpf and imaged at 3 dpf. (A,D) Wild-type larvae exposed to TCDD lack an S-shaped cardiac loop and exhibit cardiac edema, unlike vehicle-treated wild-type siblings. (B,E) arnt1 mutant larvae (arnt1bcm2/bcm2) treated with vehicle and TCDD show normal heart looping and do not have cardiac edema. (C,F) arnt2 mutant larvae (arnt2bcm3/bcm3) treated with vehicle show expected heart looping similar to wild-type siblings, but arnt2 homozygous mutant larvae treated with TCDD lack an S-shaped cardiac loop similar to wild type and exhibit cardiac edema similar to TCDD-treated wild-type larvae. Arrows indicate location of the heart. Larvae were genotyped after imaging and representative images are shown. TCDD-treated wild-type siblings of arnt1 mutant larvae, n=9 larvae across three clutches; TCDD treated arnt1 mutant larvae, n=21 larvae across three clutches. TCDD treated wild-type siblings of arnt2 larvae, n=19 larvae across three clutches; TCDD treated arnt2 mutant larvae, n=22 larvae across four clutches. All larvae are oriented with anterior towards the left and dorsal towards the top. Scale bar: 100 μm. |