
|
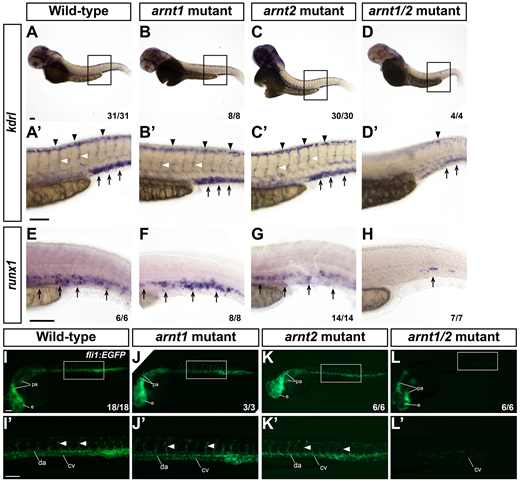
Fig. 2 arnt1/2 mutants show reduced levels of endothelial cells and runx1-positive hematopoietic cells. (A-H) Embryos were probed for kdrl (A-D′) or runx1 (E-H) using whole-mount in situ hybridization at 2 days post fertilization (dpf). (A-D) kdrl staining in wild-type, arnt1 mutant, arnt2 mutant and arnt1/2 mutant embryos. (A′-D′) Images of the trunk of each embryo near the end of the yolk extension (outlined in A-D). Black arrowheads indicate kdrl staining in the dorsal longitudinal anastomotic vessels; black arrows indicate the dorsal aorta and caudal vein; white arrowheads indicate inter-segmental vessels. (E-H) Black arrows indicate runx1 labeling in the presumptive hematopoietic stem cell niche. (I-L) Wild-type and mutant embryos on Tg(fli1:EGFP y1) transgenic background were imaged at 1 dpf and then genotyped. (I′-L′) Enlarged images of the trunk of each embryo near the end of the yolk extension (outlined in I-L). White arrowheads correspond to inter-segmental vessels. e, eye; pa, pharyngeal arch; da, dorsal aorta; cv, caudal vein. The fraction in the bottom right corner indicates the number of embryos of the given genotype with the represented phenotype over the total number of embryos of the given genotype from a single clutch. Scale bars: 100 μm.