
- Title
-
Transcriptomic data meta-analysis reveals common and injury model specific gene expression changes in the regenerating zebrafish heart
- Authors
- Botos, M.A., Arora, P., Chouvardas, P., Mercader, N.
- Source
- Full text @ Sci. Rep.
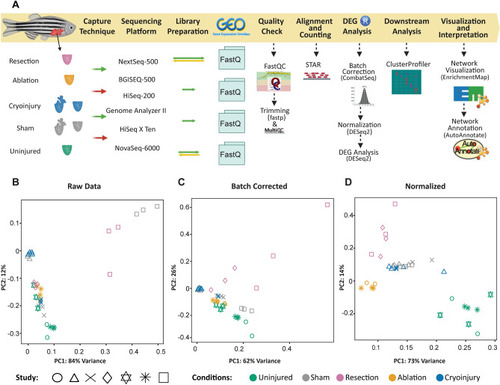
Transcriptomic meta-analysis of the cardiac regenerative response upon distinct types of injuries. (A) Workflow of the process used to analyze the data. Selected datasets differed in conditions of the transcriptomic data such as the capture techniques, sequencing platforms and reads structure. Data were downloaded from GEO and the processing steps to find the differentially expressed genes were performed. This was followed by downstream analysis to interpret the results. (B) PCA plots of the raw data before any processing. (C) Batch corrected, after removing the platform sequencing variable giving the highest batch effect. (D) DESeq2 normalized data. |
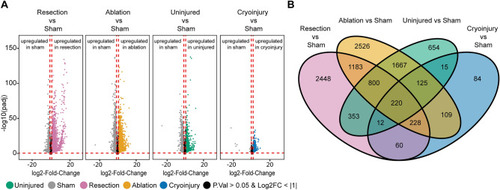
Unique and common differentially expressed genes (DEGs) in the 7 dpi regenerating zebrafish heart after resection, cryoinjury, or genetic ablation. (A) Volcano plot of the different conditions showing the DEGs. Grey, sham; orange, genetic ablation; magenta, ventricular resection; green, uninjured; blue, cryoinjury. Black area stands for non-significant genes with an adjusted p value > 0.05 or a log2FoldChange value > − 1 and < + 1 which were not considered for the analysis. (B) Venn diagram of the zebrafish DEGs converted to the respective mouse orthologs, for each condition. |
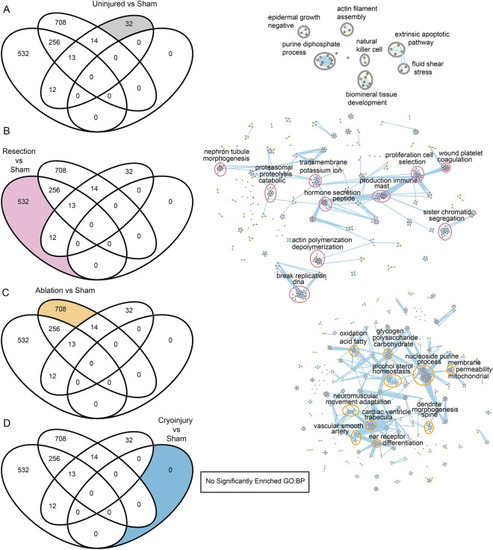
Biological process analysis of DEGs unique to different regeneration models. On the left, Venn diagrams of enriched Gene Ontology Biological Processes showing the specific GO:BP for each condition of interest analyzed labelled in color. On the right, Cytoscape representations of most enriched processes. Shown are data from the comparisons of the different injury models. (A) Uninjured vs sham, (B) Resection vs sham, (C) Ablation vs sham, (D) Cryoinjury vs sham, revealing no significantly enriched terms. |
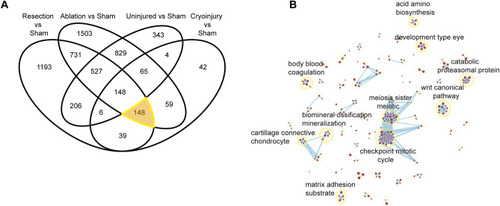
Biological pathways enriched in the core regeneration DEG set. (A) Venn diagram of the Mus musculus converted genes from the DEG analysis. Highlighting the converted genes involved in the “core regeneration” process of a heart injury despite the model used. (B) Gene Ontology Biological Processes associated to these genes when performing annotation and the clustering of these in a network. |