
Image
|
Figure Caption
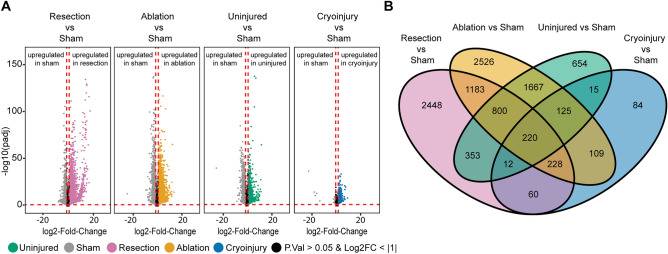
Figure 2
Unique and common differentially expressed genes (DEGs) in the 7 dpi regenerating zebrafish heart after resection, cryoinjury, or genetic ablation. (A) Volcano plot of the different conditions showing the DEGs. Grey, sham; orange, genetic ablation; magenta, ventricular resection; green, uninjured; blue, cryoinjury. Black area stands for non-significant genes with an adjusted p value > 0.05 or a log2FoldChange value > − 1 and < + 1 which were not considered for the analysis. (B) Venn diagram of the zebrafish DEGs converted to the respective mouse orthologs, for each condition.
Acknowledgments
This image is the copyrighted work of the attributed author or publisher, and
ZFIN has permission only to display this image to its users.
Additional permissions should be obtained from the applicable author or publisher of the image.
Full text @ Sci. Rep.