FIGURE SUMMARY
Title

STAT5b is a key effector of NRG-1/ERBB4-mediated myocardial growth

Authors
Vaparanta, K., Jokilammi, A., Paatero, I., Merilahti, J.A., Heliste, J., Hemanthakumar, K.A., Kivelä, R., Alitalo, K., Taimen, P., Elenius, K.
Source
Full text @ EMBO Rep.

Figure 1. NRG-1 promotes cardiomyocyte hypertrophy via ERBB4 and STAT5b

  • A, B. Confocal images (A) and quantification (B) of immunofluorescence staining of actin filaments (phalloidin) and nuclei (DAPI) in cardiomyocytes. Images of cryosections from hearts of mice transduced with either control (control AAV) or ERBB4 ectodomain-encoding (ERBB4ECD-AAV) adeno-associated viruses are shown. One dot in the scatterplot corresponds to the average cardiomyocyte thickness as defined by the thickness of the myofibril bundle per cardiomyocyte in 3–5 randomly acquired images of stained sections from one heart (for each group n = 5, biological replicates). Two-tailed unpaired T-test was used for statistics. Scale bar 20 μm.
  • C, D. Confocal images (C) and quantification (D) of immunofluorescence staining of STAT5b, actin filaments (phalloidin) and nuclei (DAPI) in cardiomyocytes of cryosections from the hearts of mice transduced with either control- or ERBB4ECD-AAV. Panel D depicts quantification of colocalization of STAT5b- and DAPI-specific signals. One dot in the boxplot corresponds to the median value in 20–50 images of stained sections from one heart (control AAV: n = 4, ERBB4ECD-AAV: n = 5, biological replicates). Two-tailed unpaired T-test was used for statistics. Scale bar 10 μm. White arrows point to cardiomyocyte nuclei.
  • E. Real-time RT-PCR analysis of expression of the indicated STAT5b target genes in the heart of mice transduced with either control- or ERBB4ECD-AAV. One dot corresponds to analysis of one heart (n = 10; biological replicates combined from two replicate experiments). Two-tailed unpaired T-test was used for statistics.
  • F, G. Confocal images (F) and quantification (G) of immunofluorescence staining of myosin heavy chain in primary mouse cardiomyocytes. The cells were treated with either control or Stat5b-targeting shRNAs and stimulated with NRG-1 for 2 days. Myosin immunoreactivity was used to quantify cell area. One dot in the boxplot corresponds to one cell (Control no NRG-1: n = 83, control with NRG1: n = 73, Stat5b#1 with NRG-1: n = 80, Stat5b#2 with NRG1: n = 75; technical replicates combined from four biological replicate experiments). Non-parametric Kruskal-Wallis ANOVA was used. Post hoc analyses were conducted with the Mann Whitney U-test and the resulting P-values were corrected with the method of Benjamini, Krieger and Yekutieli. Scale bar 20 μm.
  • H, I. Confocal images (H) and quantification (I) of immunofluorescence staining of STAT5b and nuclei (DAPI) in mouse cardiomyocytes. The cells were treated with either control or Erbb4-targeting shRNAs. Panel I depicts quantification of colocalization of STAT5b- and DAPI-specific signals (left) and the cell perimeter (right). One dot in the boxplots corresponds to one cell (Control: n = 24, Erbb4#1: n = 26, Erbb4#2: n = 35; technical replicates combined from two biological replicate experiments). Non-parametric Kruskal-Wallis ANOVA and Dunn's multicomparison test (colocalization analysis) and Brown-Forsythe one-way ANOVA and Dunnett's multicomparison test (cardiomyocyte size analysis) with multiple test correction were used for statistics. Scale bar 20 μm.
  • J. Real-time RT-PCR analysis of expression of the indicated STAT5b target genes in mouse cardiomyocytes. The cells were treated with either control, Stat5b- or Erbb4-targeting shRNAs and stimulated with NRG-1 for 30 min. One dot corresponds to the mean of technical replicates in one experiment and the whiskers the standard deviation (for each group n = 3; biological replicate experiments). One-way ANOVA and the Dunnett's multicomparison test with multiple test correction was used for statistics. *P ≤ 0.05; **P < 0.01; ***P < 0.001 against control shRNA (Igf-1 panel: Stat5b#1 P = 0.0038, Stat5b#2 P = 0.0153, Erbb4#1 P = 0.0188, Erbb4#2 P = 0.0288; Myc panel: Stat5b#1 P = 0.0093, Stat5b#2 P = 0.0119, Erbb4#1 P = 0.0197, Erbb4#2 P = 0.0512; Cdkn1a panel: Stat5b#1 P = 0.0091, Stat5b#2 P = 0.0107, Erbb4#1 P = 0.0235, Erbb4#2 P = 0.048).

Data information: For all boxplots the central band represents the median, the box the interquartile range and whiskers the whole range of values.

Source data are available online for this figure.

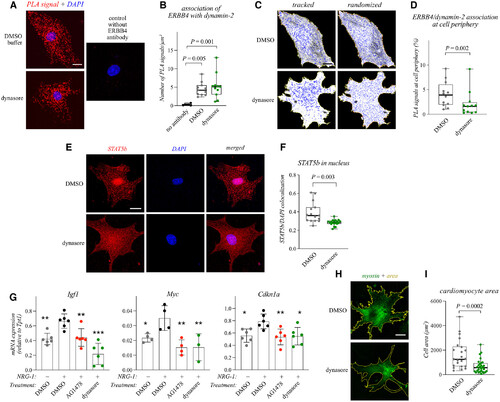
Figure 2. Dynamin-2 controls ERBB4 signaling and cardiomyocyte hypertrophy

  • A, B. Proximity ligation assay (PLA) of association of Dynamin-2 with ERBB4 in primary mouse cardiomyocytes treated with either DMSO or the dynamin inhibitor dynasore for 5 h. Panel A depicts a z projection of a stack of confocal images. PLA interactions are shown in red, nuclear stain DAPI in blue. Panel B depicts quantification of the data. One dot in the boxplot corresponds to the number of PLA signals in μm2 in one cell (Control: n = 6, DMSO buffer: n = 11, dynasore: n = 11; technical replicates from one of two biological replicate experiments). Non-parametric Kruskal-Wallis ANOVA and the Dunn's multicomparison test with multiple test correction was used for statistics. Scale bar 20 μm.
  • C, D. Analysis of the subcellular localization of the association of Dynamin-2 with ERBB4. Panel C depicts Dynamin-2/ERBB4 PLA interactions in blue in representative cells (tracked) as well as when the PLA signals were artificially randomly distributed throughout the area of the cell (randomized). Panel D depicts quantification of the PLA interactions within 1 μm distance from the edges of the cells (cell periphery). One dot in the boxplot corresponds to the fraction of PLA signals in the cell periphery in one cardiomyocyte (for each group n = 12; technical replicates combined from two biological replicate experiments). Non-parametric Mann–Whitney U-test was used for statistics. Scale bar 20 μm.
  • E, F. Confocal images I and quantification (F) of immunofluorescence staining of STAT5b and the nuclear stain DAPI in primary mouse cardiomyocytes. The cells were treated with either DMSO or dynasore for 5 h and stimulated for 15 min with NRG-1. Panel (F) depicts quantification of colocalization of STAT5b- and DAPI-specific signals. One dot in the boxplots corresponds to one cell (DMSO: n = 15, dynasore: n = 19; technical replicates combined from two biological replicate experiments). Non-parametric Mann–Whitney U-test was used for statistics. Scale bar 20 μm.
  • G. Real-time RT-PCR analysis of expression of the indicated STAT5b target genes in primary mouse cardiomyocytes treated for 1–3 h with the DMSO buffer, the ERBB kinase inhibitor AG1478, or dynasore, and stimulated or not for 30 min with NRG-1. One dot corresponds to the mean of technical replicates in one experiment and the whiskers the standard deviation (for each group in Igf-1 and Cdkn1a panel: n = 6, for each group expect the dynasore group in Myc panel: n = 4, for the dynasore group in Myc panel: n = 3; biological replicate experiments). One-way ANOVA and the Dunnett's multicomparison test with multiple test correction was used for statistics. *P < 0.05; **P < 0.01; ***P < 0.001; against DMSO + NRG-1 treatment (Igf-1 panel: DMSO without NRG-1 P = 0.0041, AG1478 P = 0.0082, dynasore P = 6.61e-06; Myc panel: DMSO without NRG-1 P = 0.0386, AG1478 P = 0.0037, dynasore P = 0.0064; Cdkn1a panel: DMSO without NRG-1 P = 0.0123, AG1478 P = 0.0064, dynasore P = 0.0092).
  • H, I. Confocal images (H) and quantification (I) of immunofluorescence staining of myosin heavy chain in primary mouse cardiomyocytes. The cells were treated with either DMSO or dynasore and stimulated with NRG-1 for 2 days. The myosin immunoreactivity was used to quantify cell area. One dot in the boxplot corresponds to one cell (DMSO: n = 22, dynasore: n = 28; technical replicates combined from three biological replicate experiments). Non-parametric Mann–Whitney U-test was used for statistics. Scale bar 20 μm.

Data information: For all boxplots the central band represents the median, the box the interquartile range and whiskers the whole range of values.

Source data are available online for this figure.

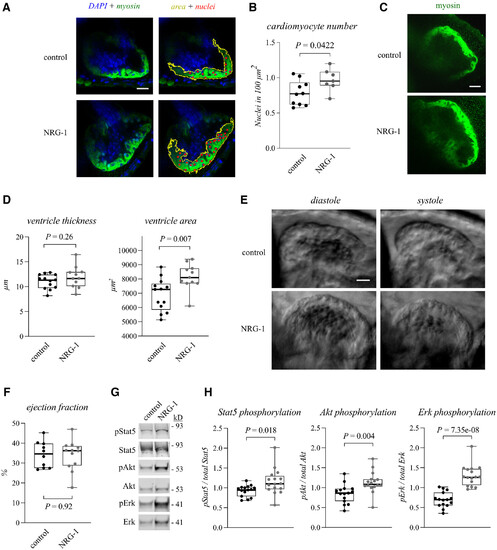
Figure 3. NRG-1 promotes hyperplastic myocardial growth and Stat5 activation in zebrafish embryos

  • A–D. Confocal images (A, C) and quantification (B, D) of immunofluorescence staining of myosin heavy chain (green) and DAPI (blue) in the hearts of 4 dpf zebrafish embryos injected with either the buffer control or NRG-1 into the pericardial sac at 2 dpf. The myosin immunoreactivity was used to quantify both the average thickness of the ventricular wall as well as the cross-sectional area of the ventricles. The number of nuclei was estimated with the DAPI stain. The number of nuclei (red) in the ventricle and the ventricle area (yellow) was quantified to differentiate between hypertrophic and hyperplastic growth. One dot in the boxplots corresponds to one heart (Control [A, B]: n = 10, NRG-1 [A, B]: n = 7, control [C, D]: n = 13, NRG-1 [C, D]: n = 11; biological replicates from two replicate experiments). Unpaired two-tailed T-test was used for statistics. Scale bars 20 μm.
  • E, F. Still frame phase contrast images of in vivo imaging of the zebrafish embryo hearts (E) and quantification of ejection fractions (F). The zebrafish embryos were treated as in (A). The ejection fractions were calculated from the videos (Movies EV1 and EV2). One dot in the boxplot corresponds to the ejection fraction of one heart (Control: n = 10, NRG-1: n = 12; biological replicates from one of two replicate experiments). Unpaired two-tailed T-test was used for statistics. Scale bar 20 μm.
  • G, H. Western analysis (G) and densitometric quantification (H) of Stat5, Akt and Erk phosphorylation in zebrafish embryos. The embryos were treated as in (A). One dot in the boxplots corresponds to the relative densitometric value of one pooled sample of 3–4 zebrafish embryos (Control: n = 15, NRG-1: n = 16; biological replicates combined from three replicate experiments). Unpaired two-tailed T-test with Welch's correction (Stat5) or unpaired two-tailed T-test (Erk, Akt) was used for statistics.

Data information: For all boxplots the central band represents the median, the box the interquartile range and whiskers the whole range of values.

Source data are available online for this figure.

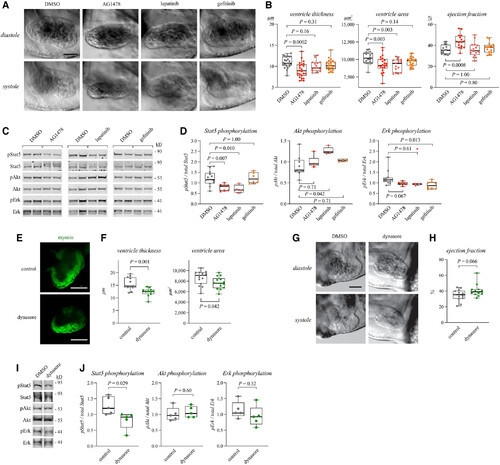
Figure 4. Erbb4 pathway regulates myocardial growth and Stat5 activation in zebrafish embryos

  • A, B. Still frame phase contrast images of in vivo imaging of the zebrafish embryo hearts at 4 dpf (A) and quantification of heart dimensions and ejection fractions (B). The embryos were treated with the buffer control DMSO or the ERBB inhibitors AG1478, lapatinib or gefitinib for 2 days. The ventricular wall thickness, cross-sectional ventricular area, and ejection fraction was quantified from the videos (Movies EV3–EV6). One dot in the boxplots corresponds to one heart (DMSO: n = 23, AG1478: n = 22, Lapatinib: n = 15, Gefitinib: n = 21, for each group in ejection fraction panel: n = 16; biological replicates). One-way ANOVA and the Dunnett's multicomparison test with multiple test correction was used for statistics. Scale bar 50 μm.
  • C, D. Western analysis (C) and densitometric quantification (D) of Stat5, Akt and Erk phosphorylation in zebrafish embryos. The embryos were treated as in (A). One dot in the boxplots corresponds to the relative densitometric value of one pooled sample of five zebrafish embryos (DMSO [Stat5] n = 13, AG1478 [Stat5] n = 7, Lapatinib [Stat5]: n = 4, Gefitinib [Stat5] n = 6, DMSO [Akt] n = 9, AG1478 [Akt] n = 3, Lapatinib [Akt] n = 3, Gefitinib [Akt] n = 3, DMSO [Erk] n = 13, AG1478 [Erk] n = 6, Lapatinib [Erk] n = 4, Gefitinib [Erk] n = 8; biological replicates combined from three replicate experiments). One-way ANOVA and the Dunnett's multicomparison test (Stat5, Akt) or non-parametric Kruskal-Wallis with Dunn's multicomparison test (Erk) was used for statistics.
  • E, F. Confocal images (E) and quantification (F) of immunofluorescence staining of myosin heavy chain in hearts of 4 dpf zebrafish embryos treated with DMSO or dynasore for 2 days. The myosin immunoreactivity was used to quantify the average thickness of the ventricular wall and the cross-sectional area of the ventricles. One dot in the boxplots corresponds to one heart (DMSO [thickness, ejection fraction] n = 11, dynasore [thickness, ejection fraction] n = 12, DMSO [area] n = 15, dynasore [area] n = 14; biological replicates). Unpaired two-tailed T-test was used for statistics. Scale bar 50 μm.
  • G, H. Still frame phase contrast images of in vivo imaging of the zebrafish embryo hearts (G) and quantification of ejection fractions (H). The zebrafish embryos were treated as in (E). The ejection fractions were calculated from the videos (Movies EV7 and EV8). One dot in the boxplot corresponds to the ejection fraction of one heart (DMSO: n = 13, dynasore: n = 12; biological replicates). Unpaired two-tailed T-test was used for statistics. Scale bar 50 μm.
  • I, J. Western analysis (I) and densitometric quantification (J) of Stat5, Akt and Erk phosphorylation in zebrafish embryos. The embryos were treated as in (E). One dot in the boxplots corresponds to the relative densitometric value of one pooled sample of five zebrafish embryos (for each group n = 5; biological replicates). Unpaired two-tailed T-test was used for statistics.

Data information: For all boxplots the central band represents the median, the box the interquartile range and whiskers the whole range of values.

Source data are available online for this figure.

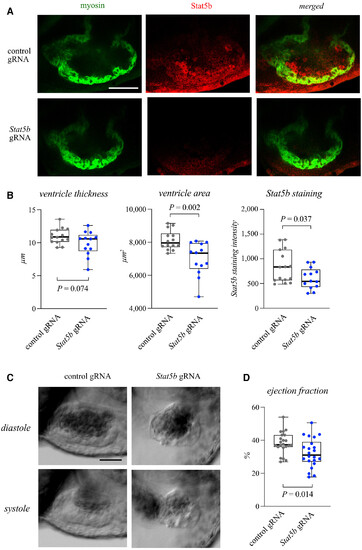
Figure 5. Stat5b is necessary for cardiac growth and function in zebrafish embryos

  • A, B. Confocal images (A) and quantification (B) of immunofluorescence staining of myosin heavy chain and Stat5b in hearts of 4 dpf zebrafish embryos injected with CRISPR/Cas9 and either control or stat5b-targeting gRNA at one-cell stage. The myosin immunoreactivity was used to quantify the average thickness of the ventricular wall and the cross-sectional area of the ventricles. Stat5b staining intensity was also quantified. One dot in the boxplots corresponds to one heart (control gRNA: n = 14, stat5b gRNA n = 13; biological replicates from one of three replicate experiments). Unpaired two-tailed T-test was used for statistics. Scale bar 50 μm.
  • C, D. Still frame phase contrast images of in vivo imaging of the zebrafish embryo hearts (C) and quantification of the ejection fraction (D). The 4 dpf embryos were treated as in A. Ejection fraction was quantified from the videos. One dot in the boxplots corresponds to ejection fraction of one heart (for each group n = 22; biological replicates from one of three replicate experiments). Unpaired two-tailed T-test was used for statistics. Scale bar 50 μm.

Data information: For all boxplots the central band represents the median, the box the interquartile range and whiskers the whole range of values.

Source data are available online for this figure.

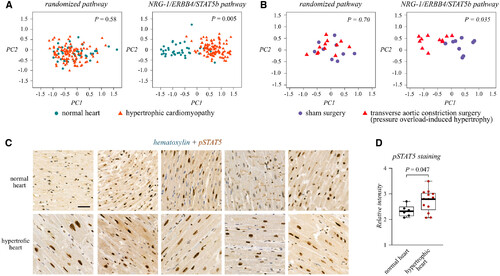
Figure 6. NRG-1/ERBB4/STAT5b signaling pathway is perturbed in pathological cardiac hypertrophy

  • A. Principal component and cluster analysis of transcripts of the NRG-1/ERBB4/STAT5b pathway (including the genes: NRG1, ERBB4, STAT5B, IGF1, MYC and DNM2) with clinical samples representing normal myocardium or hypertrophic cardiomyopathy. The dataset GSE36961 was acquired from the Gene Expression Omnibus database (Data ref: Hebl et al2012). One symbol in the plots corresponds to one subject (normal: n = 39, hypertophic cardiomyopathy n = 106; biological replicates). Statistical significance of clusterization was calculated by estimating a probability distribution for the relative distance within a cluster and between clusters and by drawing the cumulative probability from the resulting empirical cumulative probability function.
  • B. Principal component and cluster analysis of transcripts of the NRG-1/ERBB4/STAT5b pathway with samples representing myocardia of mice subjected to sham or transverse aortic constriction surgery. The dataset GSE5500 was acquired from the Gene Expression Omnibus database (Data ref: Bisping et al2006). One symbol in the scatterplots corresponds to one mouse (sham: n = 9, transverse aortic constriction: n = 12; biological replicates).
  • C, D. Immunohistochemical analysis (C) and quantification (D) of STAT5 activation in sections representing normal myocardia or pathological cardiac hypertrophy (n = 3, aortic stenosis; n = 2, idiopathic cardiomyopathy). Phospho-STAT5b staining intensity was quantified. One dot in the boxplot corresponds to one subject (normal: n = 6, hypertrophic n = 13; biological replicates). In the boxplot the central band represents the median, the box the interquartile range and whiskers the whole range of values. Unpaired two-tailed T-test was used for statistics. Scale bar 50 μm.

Source data are available online for this figure.

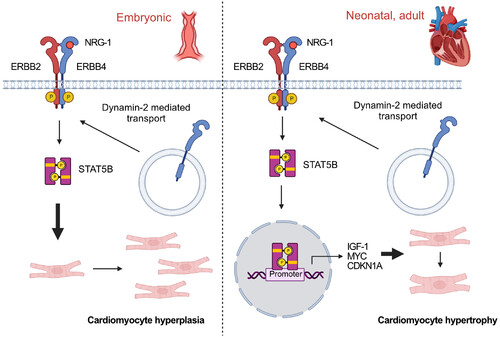
Figure 7. The proposed NRG-1/ERBB4/STAT5b pathway in cardiac growth

The pathway may regulate both cardiomyocyte hyperplasia (left) and hypertrophy (right) at different developmental stages.

Acknowledgments
This image is the copyrighted work of the attributed author or publisher, and ZFIN has permission only to display this image to its users. Additional permissions should be obtained from the applicable author or publisher of the image. Full text @ EMBO Rep.