IMAGE

Fig. 1

ID
ZDB-IMAGE-230915-28
Source
Figures for Vaparanta et al., 2023
Image
Figure Caption

Fig. 1

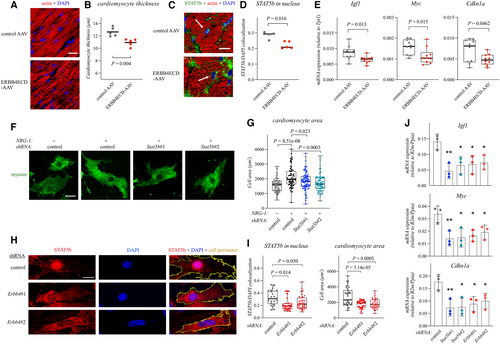
Figure 1. NRG-1 promotes cardiomyocyte hypertrophy via ERBB4 and STAT5b

  • A, B. Confocal images (A) and quantification (B) of immunofluorescence staining of actin filaments (phalloidin) and nuclei (DAPI) in cardiomyocytes. Images of cryosections from hearts of mice transduced with either control (control AAV) or ERBB4 ectodomain-encoding (ERBB4ECD-AAV) adeno-associated viruses are shown. One dot in the scatterplot corresponds to the average cardiomyocyte thickness as defined by the thickness of the myofibril bundle per cardiomyocyte in 3–5 randomly acquired images of stained sections from one heart (for each group n = 5, biological replicates). Two-tailed unpaired T-test was used for statistics. Scale bar 20 μm.
  • C, D. Confocal images (C) and quantification (D) of immunofluorescence staining of STAT5b, actin filaments (phalloidin) and nuclei (DAPI) in cardiomyocytes of cryosections from the hearts of mice transduced with either control- or ERBB4ECD-AAV. Panel D depicts quantification of colocalization of STAT5b- and DAPI-specific signals. One dot in the boxplot corresponds to the median value in 20–50 images of stained sections from one heart (control AAV: n = 4, ERBB4ECD-AAV: n = 5, biological replicates). Two-tailed unpaired T-test was used for statistics. Scale bar 10 μm. White arrows point to cardiomyocyte nuclei.
  • E. Real-time RT-PCR analysis of expression of the indicated STAT5b target genes in the heart of mice transduced with either control- or ERBB4ECD-AAV. One dot corresponds to analysis of one heart (n = 10; biological replicates combined from two replicate experiments). Two-tailed unpaired T-test was used for statistics.
  • F, G. Confocal images (F) and quantification (G) of immunofluorescence staining of myosin heavy chain in primary mouse cardiomyocytes. The cells were treated with either control or Stat5b-targeting shRNAs and stimulated with NRG-1 for 2 days. Myosin immunoreactivity was used to quantify cell area. One dot in the boxplot corresponds to one cell (Control no NRG-1: n = 83, control with NRG1: n = 73, Stat5b#1 with NRG-1: n = 80, Stat5b#2 with NRG1: n = 75; technical replicates combined from four biological replicate experiments). Non-parametric Kruskal-Wallis ANOVA was used. Post hoc analyses were conducted with the Mann Whitney U-test and the resulting P-values were corrected with the method of Benjamini, Krieger and Yekutieli. Scale bar 20 μm.
  • H, I. Confocal images (H) and quantification (I) of immunofluorescence staining of STAT5b and nuclei (DAPI) in mouse cardiomyocytes. The cells were treated with either control or Erbb4-targeting shRNAs. Panel I depicts quantification of colocalization of STAT5b- and DAPI-specific signals (left) and the cell perimeter (right). One dot in the boxplots corresponds to one cell (Control: n = 24, Erbb4#1: n = 26, Erbb4#2: n = 35; technical replicates combined from two biological replicate experiments). Non-parametric Kruskal-Wallis ANOVA and Dunn's multicomparison test (colocalization analysis) and Brown-Forsythe one-way ANOVA and Dunnett's multicomparison test (cardiomyocyte size analysis) with multiple test correction were used for statistics. Scale bar 20 μm.
  • J. Real-time RT-PCR analysis of expression of the indicated STAT5b target genes in mouse cardiomyocytes. The cells were treated with either control, Stat5b- or Erbb4-targeting shRNAs and stimulated with NRG-1 for 30 min. One dot corresponds to the mean of technical replicates in one experiment and the whiskers the standard deviation (for each group n = 3; biological replicate experiments). One-way ANOVA and the Dunnett's multicomparison test with multiple test correction was used for statistics. *P ≤ 0.05; **P < 0.01; ***P < 0.001 against control shRNA (Igf-1 panel: Stat5b#1 P = 0.0038, Stat5b#2 P = 0.0153, Erbb4#1 P = 0.0188, Erbb4#2 P = 0.0288; Myc panel: Stat5b#1 P = 0.0093, Stat5b#2 P = 0.0119, Erbb4#1 P = 0.0197, Erbb4#2 P = 0.0512; Cdkn1a panel: Stat5b#1 P = 0.0091, Stat5b#2 P = 0.0107, Erbb4#1 P = 0.0235, Erbb4#2 P = 0.048).

Data information: For all boxplots the central band represents the median, the box the interquartile range and whiskers the whole range of values.

Source data are available online for this figure.

Acknowledgments
This image is the copyrighted work of the attributed author or publisher, and ZFIN has permission only to display this image to its users. Additional permissions should be obtained from the applicable author or publisher of the image. Full text @ EMBO Rep.