IMAGE

Fig. 3

ID
ZDB-IMAGE-230915-30
Source
Figures for Vaparanta et al., 2023
Image
Figure Caption

Fig. 3

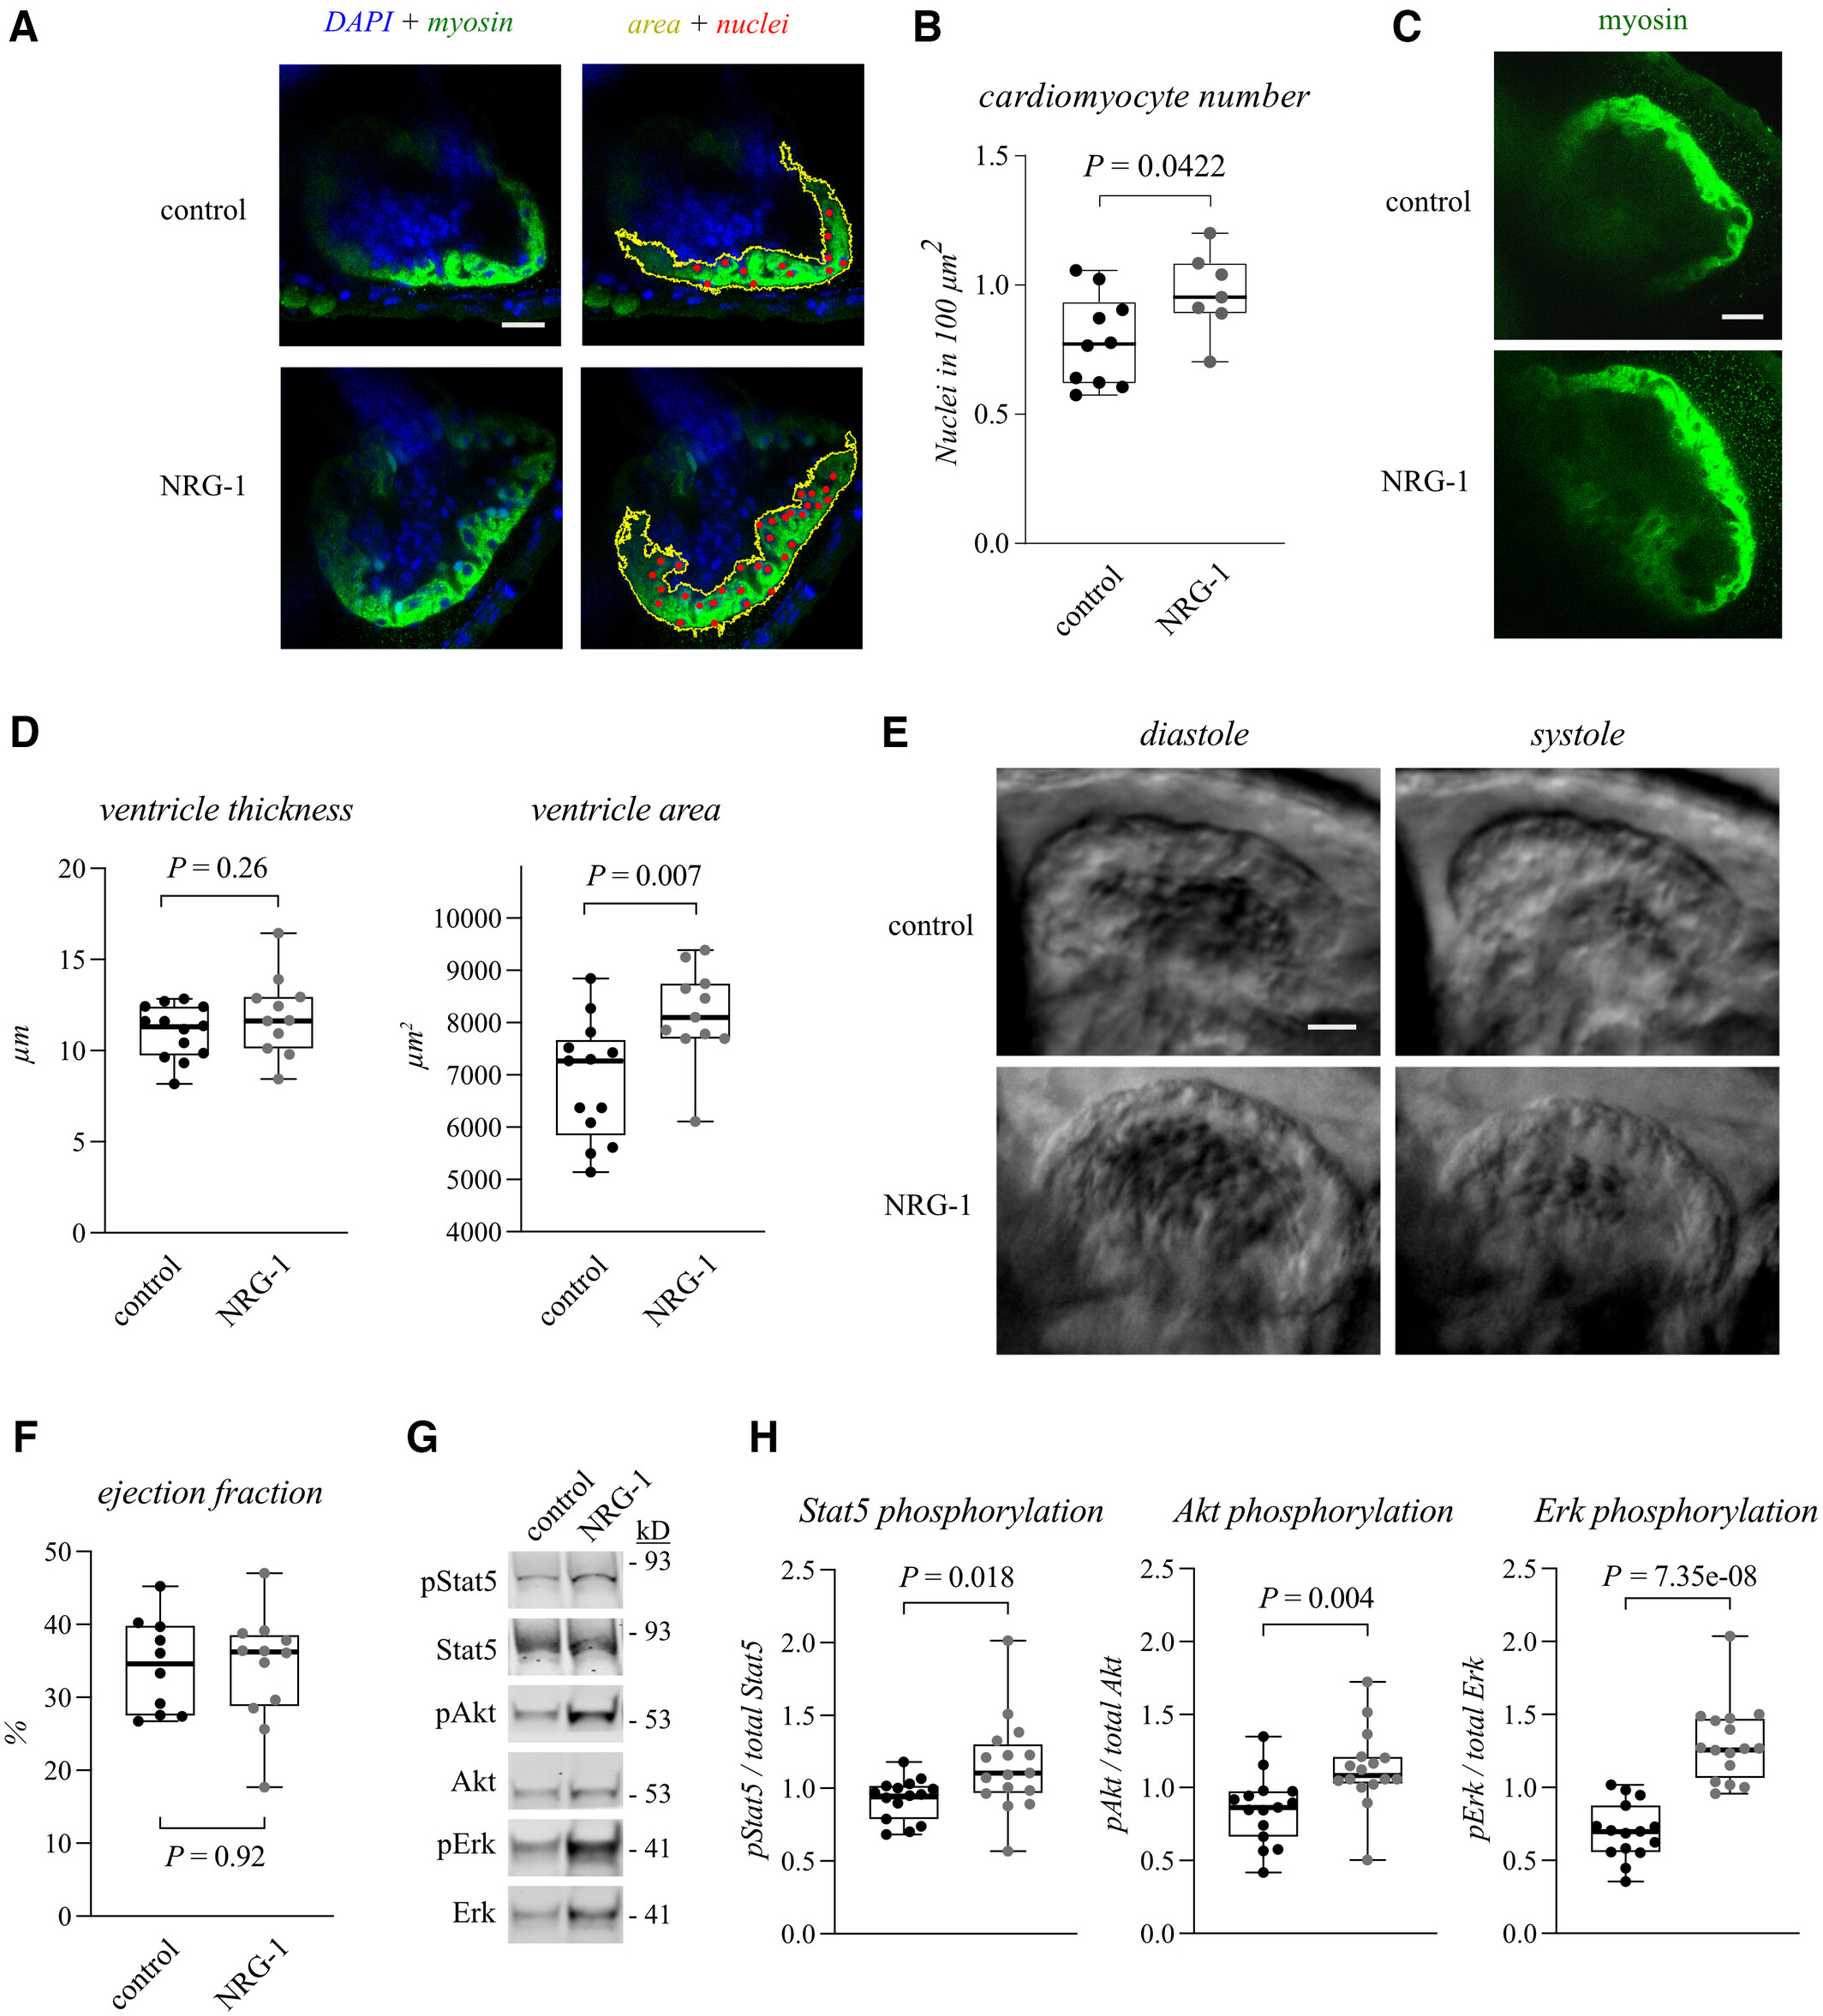
Figure 3. NRG-1 promotes hyperplastic myocardial growth and Stat5 activation in zebrafish embryos

  • A–D. Confocal images (A, C) and quantification (B, D) of immunofluorescence staining of myosin heavy chain (green) and DAPI (blue) in the hearts of 4 dpf zebrafish embryos injected with either the buffer control or NRG-1 into the pericardial sac at 2 dpf. The myosin immunoreactivity was used to quantify both the average thickness of the ventricular wall as well as the cross-sectional area of the ventricles. The number of nuclei was estimated with the DAPI stain. The number of nuclei (red) in the ventricle and the ventricle area (yellow) was quantified to differentiate between hypertrophic and hyperplastic growth. One dot in the boxplots corresponds to one heart (Control [A, B]: n = 10, NRG-1 [A, B]: n = 7, control [C, D]: n = 13, NRG-1 [C, D]: n = 11; biological replicates from two replicate experiments). Unpaired two-tailed T-test was used for statistics. Scale bars 20 μm.
  • E, F. Still frame phase contrast images of in vivo imaging of the zebrafish embryo hearts (E) and quantification of ejection fractions (F). The zebrafish embryos were treated as in (A). The ejection fractions were calculated from the videos (Movies EV1 and EV2). One dot in the boxplot corresponds to the ejection fraction of one heart (Control: n = 10, NRG-1: n = 12; biological replicates from one of two replicate experiments). Unpaired two-tailed T-test was used for statistics. Scale bar 20 μm.
  • G, H. Western analysis (G) and densitometric quantification (H) of Stat5, Akt and Erk phosphorylation in zebrafish embryos. The embryos were treated as in (A). One dot in the boxplots corresponds to the relative densitometric value of one pooled sample of 3–4 zebrafish embryos (Control: n = 15, NRG-1: n = 16; biological replicates combined from three replicate experiments). Unpaired two-tailed T-test with Welch's correction (Stat5) or unpaired two-tailed T-test (Erk, Akt) was used for statistics.

Data information: For all boxplots the central band represents the median, the box the interquartile range and whiskers the whole range of values.

Source data are available online for this figure.

Acknowledgments
This image is the copyrighted work of the attributed author or publisher, and ZFIN has permission only to display this image to its users. Additional permissions should be obtained from the applicable author or publisher of the image. Full text @ EMBO Rep.