
- Title
-
The in vivo study of cardiac mechano-electric and mechano-mechanical coupling during heart development in zebrafish
- Authors
- Baillie, J.S., Gendernalik, A., Garrity, D.M., Bark, D., Quinn, T.A.
- Source
- Full text @ Front. Physiol.

Electronic flow control system for acutely increasing cardiac preload in intact larval zebrafish. Outlet pressure of a pressurised gas cylinder is modulated by a computer-controlled high-resolution electronic pressure control system, which pressurises a conical tube filled with saline solution. Flow rate from the tube is measured by a bidirectional flow rate sensor and maintained at a set value by adjusting pressure. A micro-cannula is connected to the flow outlet, advanced with a micromanipulator under an upright fluorescence microscope to puncture the common cardinal vein (slightly upstream of where it drains into the sinus venosus), and used to inject volume into the heart. Effects of volume loading are visualised through the microscope with an industrial camera. |
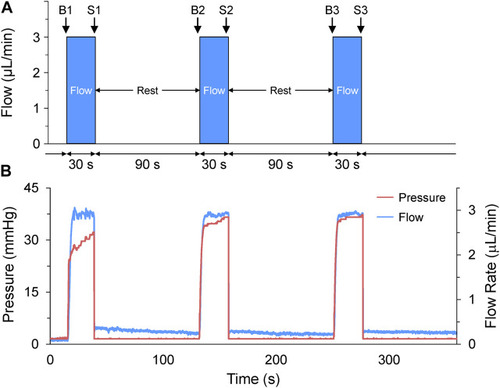
Acute volume loading protocol. (A) Acute volume loading involved three 30 s periods of 3 μL/min saline injection through the micro-cannula, with a 90 s rest period between each, and measurements taken immediately before (B1-B3) and at the end of load application (S1-S3). (B) The pressure and flow during loading were monitored and recorded by the pressure-flow control software. |
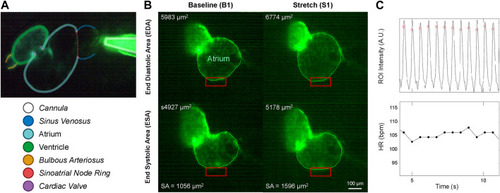
Micro-cannula placement and measurement of atrial dilation and functional effects. (A) In vivo image of the 48 hpf zebrafish heart expressing eGFP (Tg(myl7:eGFP) and the micro-cannula filled with fluorescein, showing the relative position of the cannula to various cardiac regions. (B) Videos of heart during atrial dilation were analysed in Matlab to calculate function parameters at baseline immediately before (B1-B3) and at the end of load application (S1-S3). Atrial end-diastolic (EDA) and end-systolic (ESA) area were measured by tracing the area of the atria at the end of filling and the end of ejection, respectively, from which stroke area (SA) was calculated as EDA - ESA. (C) HR was measured from the time between peaks of filtered image intensity signals, acquired by averaging intensity within a region of interest placed over the atrial wall (red boxes in B). |
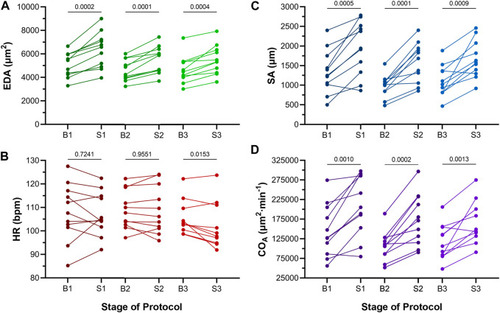
Effects of atrial dilation on functional parameters in 48 hpf zebrafish larvae. (A) End-diastolic area (EDA), (B) heart rate (HR), (C) stroke area (SA), and (D) area cardiac output (COA = HR × SA) immediately before (B1-B3) and at the end of load application (S1-S3). Mean values before and during each stretch were compared by paired two-tailed Student’s T-tests. Significance was indicated by p < 0.05. n = 11 larvae. |

Effect of repeated atrial preload application on functional parameters in 48hpf zebrafish larvae. Percentage change (%Δ) of atrial (A) end-diastolic area (EDA), (B) heart rate (HR), (C) stroke area (SA), and (D) output (COA) for each period of load application (S1, S2, S3). Average values presented as mean ± SEM. Means for each loading period were compared by repeated measures ANOVA, with Tukey post hoc tests for pairwise comparisons. n = 11 larvae. |
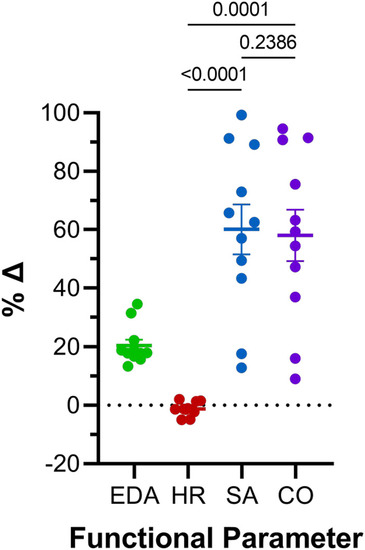
Comparison of effects of atrial preload application on functional parameters in 48 hpf zebrafish larvae. Percentage change (%Δ) of end-diastolic area (EDA), heart rate (HR), stroke area (SA), and area cardiac output (COA) averaged over all periods of load application. Average values presented as mean ± SEM. Means for each measured parameter were compared by one-way ANOVA, with Tukey post hoc tests for pairwise comparisons. n = 11 larvae. |