
- Title
-
Embryonic mercury exposure in zebrafish: Alteration of metabolites and gene expression, related to visual and behavioral impairments
- Authors
- Abu Bakar, N., Wan Ibrahim, W.N., Zulkiflli, A.R., Saleh Hodin, N.A., Kim, T.Y., Ling, Y.S., Md Ajat, M.M., Shaari, K., Shohaimi, S., Nasruddin, N.S., Mohd Faudzi, S.M., Kim, C.H.
- Source
- Full text @ Ecotoxicol. Environ. Saf.
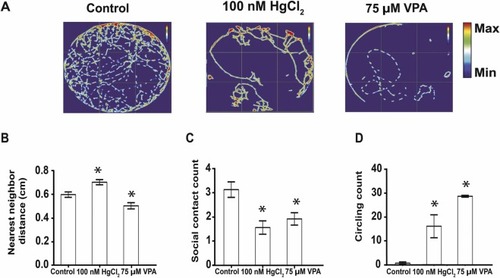
Fig. 1. Changes in social response in 10 dpf zebrafish after embryonic exposure to HgCl2 or VPA. (A) Heatmap of swimming tracking for a group of 10 larvae for 6 min recording in a 9 cm diameter petri dish. Red color indicates highly active exploration regions of group behavior. (B) Nearest neighbor distance was significantly increased in HgCl2–exposed zebrafish, while it was reduced in VPA |
 exposed zebrafish compared to control groups. (C) Number of social contacts between individual animals in HgCl2 −or VPA−exposed zebrafish were significantly reduced. (D) Abnormal circling behavior was observed in both HgCl2 − and VPA−exposed larvae (mean ± SEM: *p < 0.005, n = 30 for each group, 10 animals in a group, repeated 3 times).
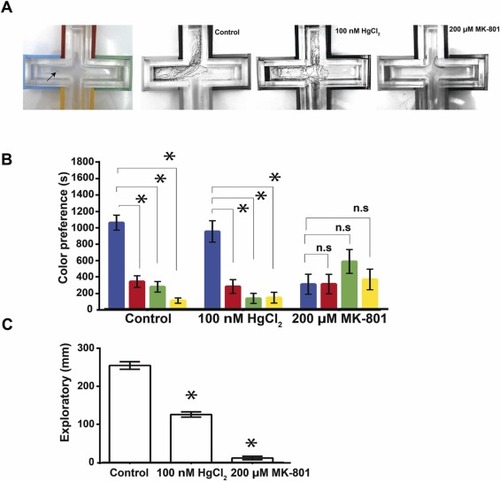
Fig. 2. Color preference test for visual recognition in 11 dpf zebrafish after embryonic HgCl2 exposure. (A) Video tracking of free–swimming zebrafish for 30 min. A single zebrafish (indicated by an arrow) was positioned individually in the center of a cross maze equipped with four different colored sleeves. AnimalTracker in ImageJ software was used for analysis. Color preference itself was not significantly changed (B), but exploratory activity (distance travelled) was reduced in HgCl2–exposed zebrafish (C) compared with controls (most preferred: blue > red > green > yellow). However, green and yellow were the least preferred in HgCl2–exposed zebrafish. An NMDA receptor antagonist MK− 801 displayed no color preference and significantly reduced exploratory activity (mean ± SEM: *p < 0.005, n = 30 for each group). |
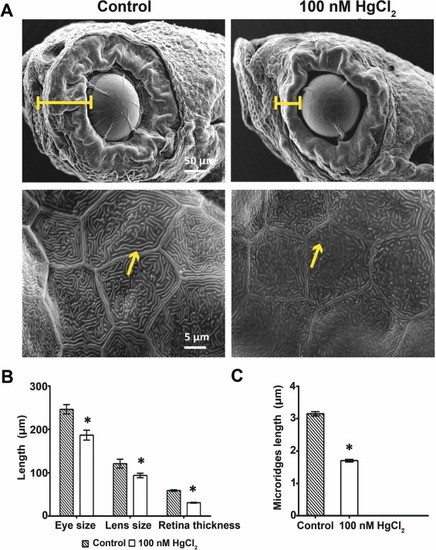
Fig. 3. Scanning electron microscopic (SEM) analyses of HgCl2–exposed zebrafish at 6 dpf. (A) Eye and lens size, retinal thickness (indicated by bar size), and microridges (arrow) in keratinocytes were examined. (B) Measurements of eye size, lens size, and retinal thickness. Embryonic exposure to HgCl2 caused a significant decreased in ocular structures. (C) Reduction in microridge length in keratinocytes in HgCl2–exposed zebrafish compared with control (mean ± SEM: *p < 0.05, n = 10 for each group). |

Fig. 4. OPLS–DA. (A–D) Score plot and loading scatter plot of positive and negative modes in reference to normalized data of the zebrafish larvae exposed to 100 nM HgCl2 compared to control. (E) Hierarchical clustering using log2 fold change value generate heatmap of the top 25 downregulated (blue) and upregulated (red) metabolites from the positive and negative ion modes after embryonic exposure to HgCl2 compared to control (F) Targeted enrichment analysis obtained from –log of p–values and pathway impact values via the topology analysis lists potential signaling pathways dysregulated (yellow < orange < red – increasing statistical significance, circle diameter – pathway impact) after embryonic exposure to HgCl2. |

Fig. 5. Embryonic exposure to HgCl2 induced alteration of transcriptional regulation of ASD–related genes. HgCl2 exposure revealed significant downregulation of, tsc1b, nrxn1a, shank3a, and adsl, genes (mean ± SEM: *p < 0.05, n = 90 for each group). |