
- Title
-
Zebrafish ELL-associated factors Eaf1/2 modulate erythropoiesis via regulating gata1a expression and WNT signaling to facilitate hypoxia tolerance
- Authors
- Liu, W., Lin, S., Li, L., Tai, Z., Liu, J.X.
- Source
- Full text @ Cell Regen (Lond)
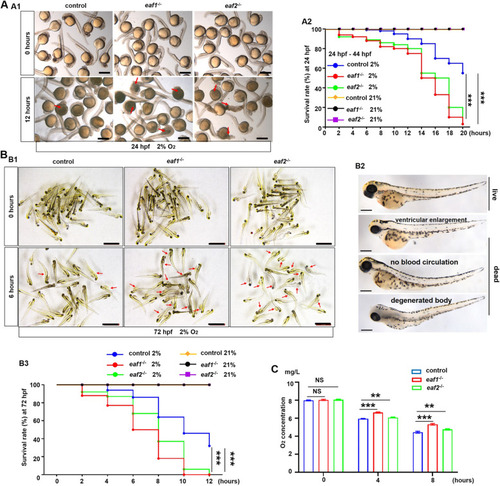
Effects of eaf1/2 deficiency on hypoxia tolerance in zebrafish. A Representative images of eaf1−/−, eaf2−/−, and WT embryos exposed to hypoxia (2% O2) beginning at 24 hpf for 12 h and dead larvae were marked by red arrows (A1), and the survival rate curves of eaf1−/−, eaf2−/− and wild-type (WT) embryos (A2). B Representative images of eaf1−/−, eaf2−/−, and WT larvae exposed to hypoxia beginning at 72 hpf for 12 h (B1), the representative images of living and dead larvae (marked by red arrows) (B2), and the survival rate curves of each group (B3). The oxygen concentration of the hypoxia workstation was adjusted to 2% before the experiment. The dead larvae were counted once every two hours, 30 embryos/larvae per group with three replicates. C Oxygen consumption rate was lower in eaf1−/− and eaf2−/− than in their WT siblings (6 mpf). Each experiment was repeated at least three times, with similar results for two or three replicates, and a representative result was shown. Data are mean ± SD. Hpf, hours post fertilization; dpf, days post fertilization; mpf, months post fertilization. B2, lateral view, anterior to the left. *P < .05, **P < .01, ***P < .001. NS, not significant. Scale bar = 2 mm (A1 and B1) and 100 μm (B2) |
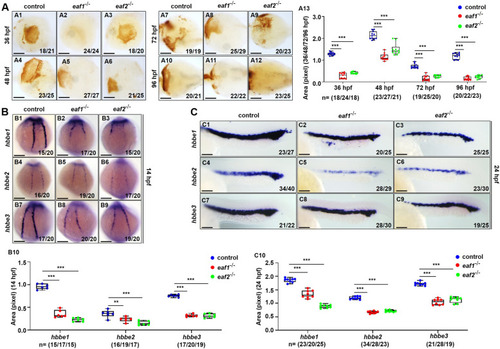
Effects of eaf1/2 deficiency on erythrogenesis. A O-dianisidine staining analysis of erythrocytes at 36, 48, 72 and 96 hpf in both eaf1−/− and eaf2−/− embryos and larvae relative to WT (A1-A12). Statistical analysis of O-dianisidine staining results (A13). B, C WISH analysis of the expression of embryonic hemoglobin, hbbe1/hbbe2/hbbe3 in eaf1−/−, eaf2−/−, and WT embryos at 14 hpf (B1-B9) and 24 hpf (C1-C9), respectively. The statistical analysis of WISH hemoglobin gene staining results for eaf1−/−, eaf2−/−, and WT embryos at 14 hpf (B10) and 24 hpf (C10), respectively. Each experiment was repeated at least three times, with similar results for two or three replicates, and a representative result was shown. Data are mean ± SD. A1-A12, ventral view, anterior to the left. B1-B9, dorsal view, anterior to the top. C1-C9, lateral view, anterior to the left. *P < .05, **P < .01, ***P < .001. NS, not significant. Scale bar = 75 μm (A1-A12) and 200 μm (B1- B9, C1- C9) |
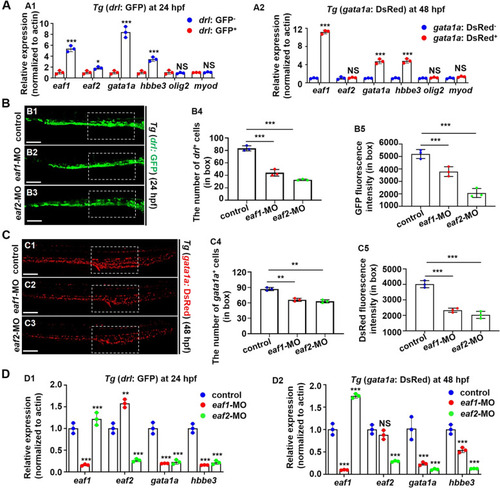
Effects of eaf1/2 deficiency in erythrocytic-fluorescence transgenic fish. A Gene expressions, eaf1, eaf2, gata1a, |
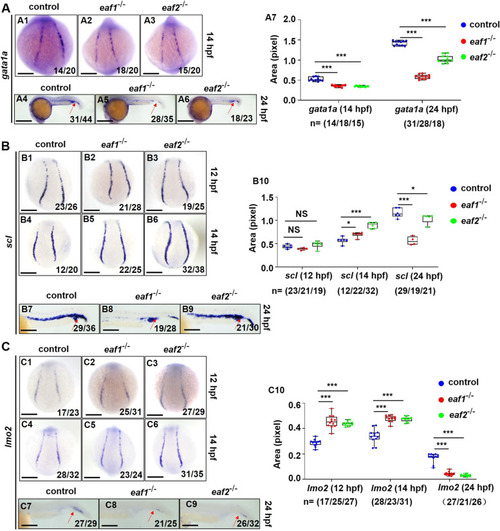
Effects of eaf1/2 deficiency on the expression of erythrogenesis transcriptional factors. A WISH analysis of the expression of erythrogenesis transcriptional factor gata1a in eaf1−/−, eaf2−/−, and WT embryos at 14 hpf (A1-A3) and 24 hpf (A4-A6), and statistical analysis of gata1a staining results (A7). B WISH analysis of the expression of erythrogenesis transcriptional factor scl in eaf1−/−, eaf2−/−, and WT embryos (B1-B6) at 12/14 hpf and 24 hpf (B7-B9), and statistical analysis of scl staining results (B10). C WISH analysis of the expression of erythrogenesis transcriptional factor lmo2 in eaf1−/−, eaf2−/−, and WT embryos at 12/14 hpf (C1-C6) and at 24 hpf (C7-C9). (C10) Statistical analysis of lmo2 staining results. Each experiment was repeated at least three times, with similar results for two or three replicates, and a representative result was shown. Data are mean ± SD. A1-A3, B1-B6, C1-C6, dorsal view, anterior to the up; A4-A6, B7-B9, C7-C9, lateral view, anterior to the left. *P < .05, **P < .01, ***P < .001. NS, not significant. Scale bar = 75 μm (A1-A3, B1-B6, C1-C6), 200 μm (A4-A6), and 50 μm (B7-B9, C7-C9) |
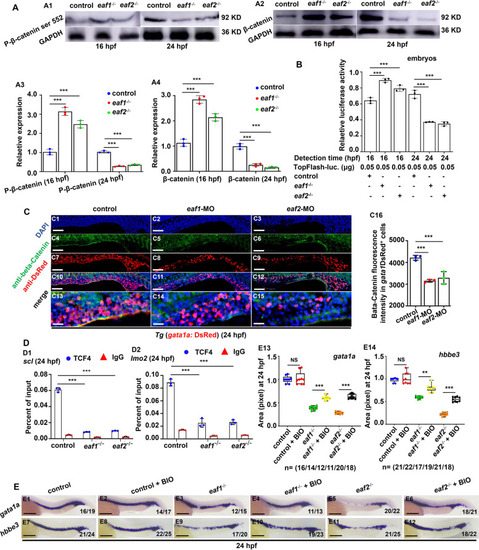
Effects of eaf1/2 deficiency on WNT/β-catenin signaling during fish erythrogenesis. A Protein levels of P-β-catenin ser 552 and β-catenin in eaf1−/−, eaf2−/−, and WT embryos at 16 hpf and 24 hpf (A1-A2), respectively, and quantitative analysis of protein level in each sample (A3-A4). B Endogenous WNT/β-catenin signaling activities in eaf1−/−, eaf2−/−, and WT embryos at 16 hpf and 24 hpf, respectively. One-cell stage embryos were injected with TopFlash (as a reporter) and TK-renilla (as an internal control) together, and the injected embryos were collected for assays at 16 hpf and 24 hpf, respectively. C Double staining of gata1aDsRed+ and β-Catetin, in the control and embryos injected with eaf1-MO or eaf2-MO at 24 hpf (C1-C15), and quantification of β-Catenin immunofluorescence intensities in gata1aDsRed+ cells (C16), and C13-C15 show the magnified views of C10-C12, respectively. D Chromatin immunoprecipitation (ChIP) analysis of the binding enrichment of protein TCF4 on the promoter of gene scl (D1) and gene lmo2 (D2) in eaf1−/− and eaf2−/− embryonic cells at 24 hpf, respectively, with anti- IgG used as a negative control. E WISH analysis of the expression of gata1a and hbbe3 in eaf1−/−, eaf2−/−, WT embryos and the corresponding groups treated with Wnt activator BIO at 24 hpf (E1-E12), and statistical analysis of WISH results (E13, E14). Each experiment was repeated at least three times, with similar results for two or three replicates, and a representative result was shown. Data are mean ± SD. C1-C15, E1-E12, lateral view, anterior to the left. *P < .05, **P < .01, ***P < .001. NS, not significant. Scale bar = 200 μm (E1-E12), 100 μm (C1-C12), and 50 μm (C13-C15) |
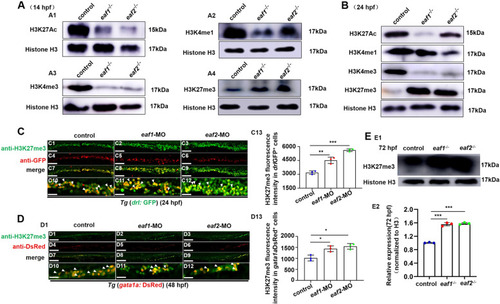
Effects of eaf1/2 deficiency on the protein levels of H3K27ac, H3K4me1, H3K4me3, and H3K27me3. A Protein levels of H3K27ac, H3K4me1, H3K4me3, and H3K27me3 in eaf1−/−, eaf2−/−, and WT embryos at 14 hpf (A1-A4) and at 24 hpf (B). C, D Double staining of drlGFP+ and H3K27me3 (C1-C12), and gata1aDsRed+ and H3K27me3 (D1-D12), in the control and embryos injected with eaf1-MO and eaf2-MO at 24 hpf or 48 hpf, and quantification of H3K27me3 immunofluorescence intensities in drlGFP+ cells (C13) and gata1aDsRed+ cells (D13), with white arrowheads indicating double-positive cells. C10-C12 and D10-D12 show the magnified views of C7-C9 and D7-D9, respectively. E Western blotting analysis of H3K27me3 protein level in eaf1−/−, eaf2−/− and WT larvae at 72 hpf (E1), and quantification of H3K27me3 (E2). Each experiment was repeated at least three times, with similar results for two or three replicates, and a representative result are shown. Data are mean ± SD. C1-C12, D1-D12, lateral view, anterior to the left. *P < .05, **P < .01, ***P < .001. NS, not significant. Scale bar = 100 μm (C1-C9, D1-D9) and 50 μm (C10-C12, D10-D12) |
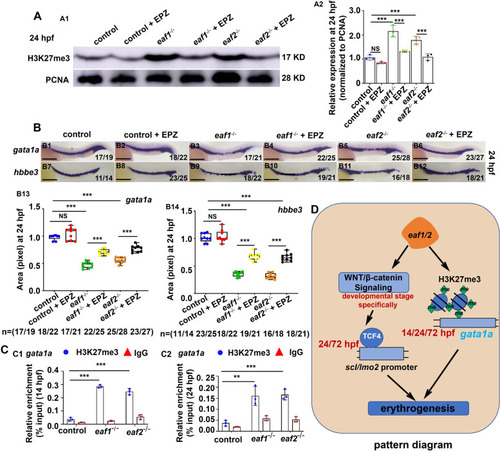
H3K27me3 protein level and expression of gata1a and hbbe3 could be recovered effectively by H3K27 methylation inhibitor (EPZ005687) in eaf1−/− and eaf2−/− mutants. A Western blotting analysis of H3K27me3 protein level in eaf1−/−, eaf2−/− and WT larvae, and the corresponding groups treated with EPZ (EPZ005687) at 24 hpf (A1), and quantification of H3K27me3 protein (A2). B WISH analysis of the expression of gata1a and hbbe3 in eaf1−/−, eaf2−/−, WT embryos and the corresponding groups treated with EPZ (EPZ005687) at 24 hpf (B1-B12), and statistical analysis of WISH results (B13, B14). C ChIP-qPCR analysis of the binding enrichment of protein H3K27me3 on the promoter of gene gata1a in eaf1−/− and eaf2−/− embryonic cells at both 14 hpf (C1) and 24 hpf (C2), with anti- IgG used as a negative control. |