
Fig. 6
- ID
- ZDB-FIG-230403-25
- Publication
- Liu et al., 2023 - Zebrafish ELL-associated factors Eaf1/2 modulate erythropoiesis via regulating gata1a expression and WNT signaling to facilitate hypoxia tolerance
- Other Figures
- All Figure Page
- Back to All Figure Page
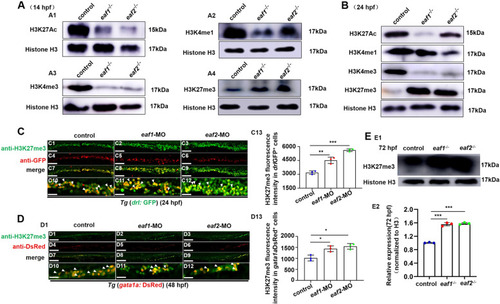
Effects of eaf1/2 deficiency on the protein levels of H3K27ac, H3K4me1, H3K4me3, and H3K27me3. A Protein levels of H3K27ac, H3K4me1, H3K4me3, and H3K27me3 in eaf1−/−, eaf2−/−, and WT embryos at 14 hpf (A1-A4) and at 24 hpf (B). C, D Double staining of drlGFP+ and H3K27me3 (C1-C12), and gata1aDsRed+ and H3K27me3 (D1-D12), in the control and embryos injected with eaf1-MO and eaf2-MO at 24 hpf or 48 hpf, and quantification of H3K27me3 immunofluorescence intensities in drlGFP+ cells (C13) and gata1aDsRed+ cells (D13), with white arrowheads indicating double-positive cells. C10-C12 and D10-D12 show the magnified views of C7-C9 and D7-D9, respectively. E Western blotting analysis of H3K27me3 protein level in eaf1−/−, eaf2−/− and WT larvae at 72 hpf (E1), and quantification of H3K27me3 (E2). Each experiment was repeated at least three times, with similar results for two or three replicates, and a representative result are shown. Data are mean ± SD. C1-C12, D1-D12, lateral view, anterior to the left. *P < .05, **P < .01, ***P < .001. NS, not significant. Scale bar = 100 μm (C1-C9, D1-D9) and 50 μm (C10-C12, D10-D12) |