IMAGE

Fig. 3

ID
ZDB-IMAGE-230403-18
Source
Figures for Liu et al., 2023
Image
Figure Caption

Fig. 3

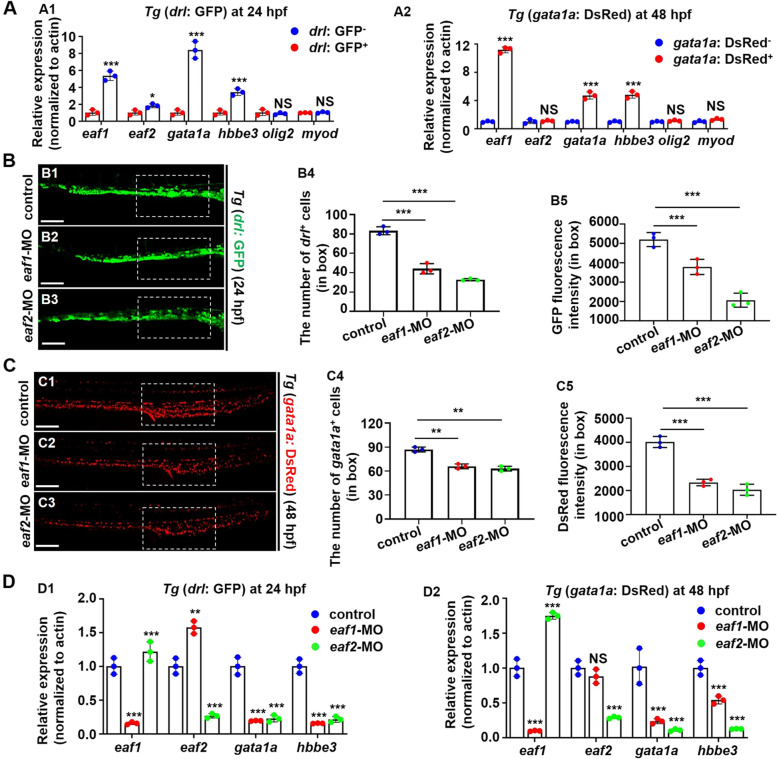
Effects of eaf1/2 deficiency in erythrocytic-fluorescence transgenic fish. A Gene expressions, eaf1, eaf2, gata1a, hbbe3, olig2 and myod, in drl+ or gata1+ cells collected from Tg (drl: GFP) (A1) and Tg (gata1a: DsRed) (A2) embryos, respectively. B, C Representative images of Tg (drl: GFP) (B1-B3) and Tg (gata1a: DsRed) embryos (C1-C3) injected with eaf1-MO or eaf2-MO at 24 hpf or 48 hpf, respectively, and quantification of the number of drl+ cells (B4) and gata1a+ cells (C4), and the GFP (B5) and DsRed (C5) fluorescence intensity in white box. D Gene expressions, eaf1, eaf2, gata1a, hbbe3, olig2 and myod, in drl+ or gata1a+ cells collected from Tg (drl: GFP) (D1) and Tg (gata1a: DsRed) (D2) embryos injected with eaf1-MO or eaf2-MO, respectively. Each experiment was repeated at least three times with similar results for two or three replicates, and a representative result was shown. B1-B3, C1-C3, lateral view, anterior to the left. *P < .05, **P < .01, ***P < .001. NS, not significant. Scale bar = 100 μm (B1-B3, C1-C3)

Acknowledgments
This image is the copyrighted work of the attributed author or publisher, and ZFIN has permission only to display this image to its users. Additional permissions should be obtained from the applicable author or publisher of the image. Full text @ Cell Regen (Lond)