
- Title
-
Variations in the poly-histidine repeat motif of HOXA1 contribute to bicuspid aortic valve in mouse and zebrafish
- Authors
- Odelin, G., Faucherre, A., Marchese, D., Pinard, A., Jaouadi, H., Le Scouarnec, S., FranceGenRef Consortium, Chiarelli, R., Achouri, Y., Faure, E., Herbane, M., Théron, A., Avierinos, J.F., Jopling, C., Collod-Béroud, G., Rezsohazy, R., Zaffran, S.
- Source
- Full text @ Nat. Commun.
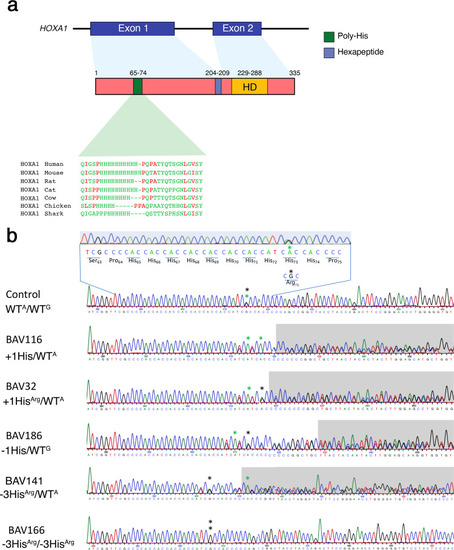
a Schematic representation of the human HOXA1 gene and corresponding predicted protein. The HOXA1 protein contains the histidine repeat motif (green; amino acids 65–74), the hexapeptide motif involved in the interaction with PBX proteins (blue; amino acids 204–209), encoded in exon 1, and the DNA-binding homeodomain (HD; yellow; amino acids 229-288), encoded in exon 2. Alignment of the HOXA1 histidine repeat sequences from the human, mouse, rat, cat, cow, chicken and shark species is represented. The NCBI GenBank accession numbers that were utilized for the alignment are as follows: Human-P49639, Mouse-P09022, Rat-O08656, Cat-M3W8N7, Cow-E1B918, Chicken-R4GHI8, and Shark-C7B9D2. b Sanger sequences showing the insertion or deletion variants observed in exon 1 of HOXA1. The polymorphism c.218G>A (p.Arg73His) is shown with asterisks (black, c.218G; green, c.218G>A). We identified different variants in this region (c.[213_215dupCCA;218G>A] named +1His; c.[213_215dupCCA;218G] named +1HisArg; c.[213_215delCCA;218G>A] named −1His and c.[207_215delCCACCACCA;218 G] named −3HisArg) with low frequency in gnomAD (see Table 3). |

a–d HEK293T cells were transfected with expression vectors coding for FLAG-HOXA1 (WTA, + 1His, +1HisArg, −1His, −1HisArg and −3HisArg). To determine the half-life of HOXA1, cells were treated with cycloheximide (CHX; 200 μg/ml) for the indicated time. |
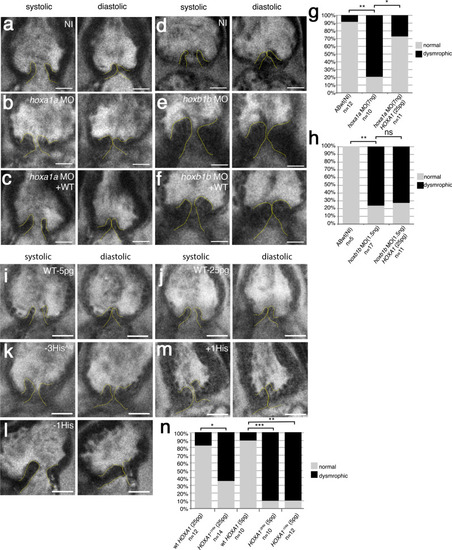
Two-photon images of aortic valves in 7 dpf zebrafish larvae labeled with BODIPY. a, d Representative image of aortic valve leaflets in a wild-type, non-injected larvae (ABwt, NI), valves are outlined with a dashed yellow line (a: n = 12; d: n = 5). bhoxa1a morphant (n = 10). choxa1a morphant co-injected with wild-type human HOXA1 mRNA (n = 11). ehoxb1b morphant (n = 17). fhoxb1b morphant co-injected with wild-type human HOXA1 mRNA (n = 11). g Graph showing quantification of aortic valve defects observed in 7 dpf larvae after knockdown of hoxa1a. Approximatively 80% of hoxa1a morphants exhibited aortic valve defects (**p = 0.0015; *p = 0.03). HOXA1 human mRNA rescued the hoxa1a morpholino aortic valve phenotype. h Graph showing quantification of aortic valve defects observed in 7 dpf larvae after knockdown of hoxb1b (**p = 0.0048). human HOXA1 mRNA does not rescue the hoxb1b morpholino aortic valve phenotype. i, j Representative images of aortic valve leaflets after injection of WT human HOXA1 mRNA (WT) at 5 pg (n = 10) or 25 pg (n = 12), respectively. k Injection of the −3HisArg variant of human HOXA1 at 5 pg (n = 10). l Injection of the −1His variant of human HOXA1 at 5 pg (n = 12). m Injection of the +1His variant of human HOXA1 at 25 pg (n = 14). n Graph showing quantification of aortic valve defects observed in 7 dpf larvae after injection of the variants of human HOXA1 (***p = 0.001; **p = 0.0037; *p = 0.021). Statistical values were obtained using Fisher exact test. Scale bars: 20 μm. Source data are provided as a Source data file. PHENOTYPE:
|

a, b Hematoxylin and eosin (H&E) staining images showing representative transversal section of wild-type (WT) and Hoxa1−/− outflow tract at E13.5. Representative pictures from 3 independent hearts of each genotype. c, d Three-dimensional (3D) reconstructions of histological images at E13.5. A slight difference between WT (c) and Hoxa1−/− (d) aortic valve (AoV) structure is observed. Indeed, the non-coronary leaflet (NC) seems smaller in Hoxa1−/− when compared to wild-type embryos. e, f Cross-sectional H&E images through the aortic valve of WT (e) and Hoxa1−/− (f) embryos at E18.5. Representative pictures from 3 independent hearts of each genotype. Normal valve with three leaflets (asterisks) is observed in WT embryos (f), whereas bicuspid aortic valve is detected in the mutant (f). Asterisks indicate the aortic sinus. g, h 3D reconstruction of histological images at E18.5 showing three aortic valve leaflets in the WT embryo (g), whereas a persistent small non-coronary leaflet is seen in Hoxa1−/− embryos (h). i, j Cross-sectional H&E images through the aortic valve of WT (i) and Hoxa1−1His/−1His (j) embryos at E18.5. Representative pictures from 4 independent hearts of each genotype. Normal valve with three leaflets (asterisks) is observed in WT embryos (i), whereas bicuspid aortic valve is detected in the knock-in embryos (f). Left coronary (L; pink), right coronary (R; yellow), non-coronary (NC; blue) leaflets; PV, pulmonary valve. Scale bars: 100 μm (a, b); 200 μm (e, f, I, j). |
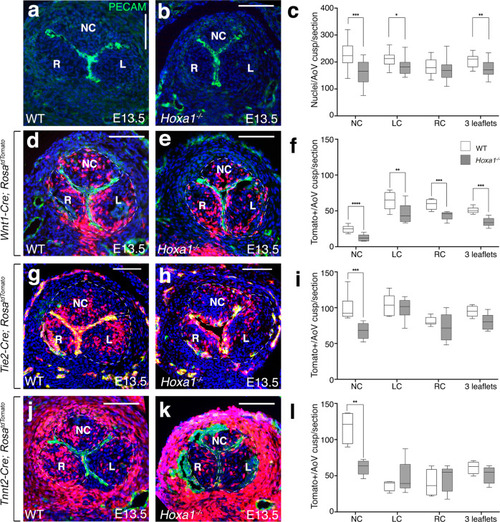
a, b Transversal sections of E13.5 hearts immunostained with an endothelial marker (anti-Pecam antibody, green) and DAPI staining for nuclei (blue). Note the smaller non-coronary (NC) leaflet in Hoxa1−/− (b) compared with WT (a) embryos. c Total nuclei were counted in the three forming aortic valve leaflets from Hoxa1−/− (n = 20) and WT (n = 18) embryos at E13.5 spanning a 180 μm depth (***p = 0.0006; **p = 0.0009; *p = 0.01). d–l Fate-mapping of the neural crest-, endothelial- and second heart field-lineages in the aortic valves of WT (d, g, j), and Hoxa1-null (e, h, k) embryos at E13.5. Tomato-reporter is visualized in red and nuclei (DAPI) appear in blue. |

a Scheme showing which region was used to perform RNA-seq analysis on Hoxa1−/− vs WT embryos. b Volcano plot of fold changes and corresponding FDR (False Discovery Rate) value for each RNA after comparison of Hoxa1−/− and WT embryos. The red and green dots represent RNAs with fold change >2.0 and FDR < 0.05. The black dots represent RNAs with fold change <2.0 and FDR > 0.05. The statistical test used for data analysis is package R EnhancedVolcano. c Gene ontology (GO) analysis performed with ClusterProfiler system showing enrichment of up-regulated (red) and down-regulated (green) genes in the mutant with ranked by −log10 (p-value). The statistical test used for data analysis is package R clusterProfiler. d Boxplot of FPKM (Fragments Per Kilo base of transcript per Million mapped fragments) expression value for nine selected DE genes in RNA-seq. Boxes and whiskers (min to max) show the values of lower and upper quartile. The y-axis represents the FPKM expression level, and the x-axis the genotype. Data are shown as mean ± SEM. Data are representative of three biologically independent experiments. |
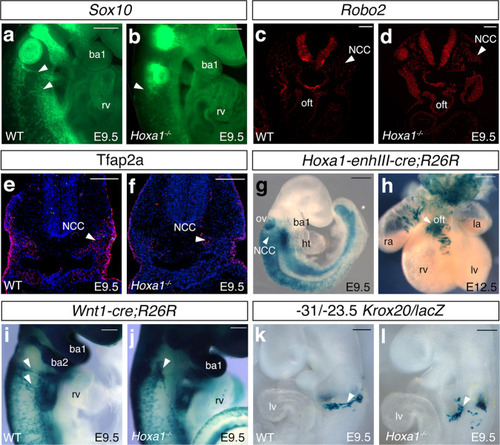
a, b RNA-FISH showing the expression of Sox10 (green) in wild-type (WT) (a) and Hoxa1−/− (b) E9.5 embryos. Lateral view of Sox10 staining revealed a decrease of expression in the migrating neural crest cells (arrowheads). c, d, RNA-FISH showing Robo2 expression (green) in wild-type (c) and Hoxa1−/− (d) E9.5 embryos. Expression of Robo2 is higher in Hoxa1−/− than wild-type littermates. e, f Cross-sections of wild-type (e) and Hoxa1−/− embryos (f) immunostained with anti-Tfap2-alpha antibody (red). Note the reduction of Tfpa2-alpha positive cells in the mutant (arrowhead). g, hHoxa1-lineage visualized by X-gal staining of Hoxa1-enhIII-cre;R26R-lacZ embryos. g, Lateral view showing β-galactosidase activity in migrating neural crest cells (NCC; arrowhead) in transgenic embryo at E9.5. h, At E12.5, β-galactosidase activity is observed in the outflow tract (OFT). i, j, Whole-mount X-gal staining of Wnt1-cre;R26R-lacZ WT (i) and Hoxa1−/− (j) E9.5 embryos. Migration of neural crest cells (arrowhead) is disrupted in Hoxa1−/− embryos (j) compared to WT (i) littermate embryos. k, l Whole-mount X-gal staining of −31/−23.5 Krox20/lacZ WT (k) and Hoxa1−/− (l) E9.5 embryos. Migration of β-galactosidase-positive cells (arrowhead) is disrupted Hoxa1−/− (l) compared to WT (k) littermate embryos. ba: branchial arch; ht, heart tube; la, left atrium; lv, left ventricle; NCC, neural crest cells; ov, otic vesicle; oft, outflow tract; ra, right atrium; rv, right ventricle. Data are representative of 3 independent embryos of each genotype. Scale bars: 100 μm (c–g), 200 μm (a, b, h, l). |

ZFIN is incorporating published figure images and captions as part of an ongoing project. Figures from some publications have not yet been curated, or are not available for display because of copyright restrictions. EXPRESSION / LABELING:
|
|
ZFIN is incorporating published figure images and captions as part of an ongoing project. Figures from some publications have not yet been curated, or are not available for display because of copyright restrictions. PHENOTYPE:
|
|
ZFIN is incorporating published figure images and captions as part of an ongoing project. Figures from some publications have not yet been curated, or are not available for display because of copyright restrictions. |