
- Title
-
Genetic hyperactivation of Nrf2 causes larval lethality in Keap1a and Keap1b-double-knockout zebrafish
- Authors
- Bian, L., Nguyen, V.T., Tamaoki, J., Endo, Y., Dong, G., Sato, A., Kobayashi, M.
- Source
- Full text @ Redox Biol.
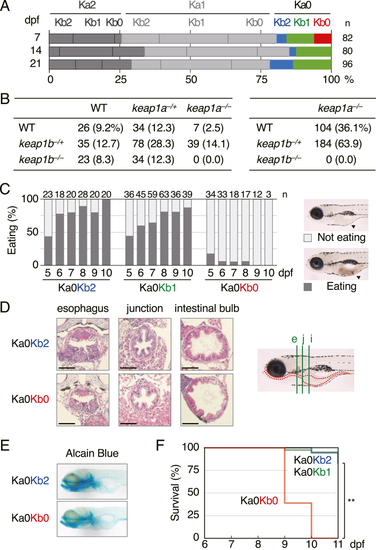
Phenotypes of keap1a;keap1b-DKO zebrafish. (A) Survival rates of offspring from heterozygous keap1a;keap1b-DKO (Ka1Kb1) parents at 7, 14, and 21 dpf. The red bar represents homozygous keap1a;keap1b-DKO (Ka0Kb0) larvae. (B) Survival rates of 3-mpf offspring from Ka1Kb1 parents (left) and Ka0Kb1 parents (right). WT, −/+, and −/− indicate wild-type, heterozygous, and homozygous fish, respectively. Data from 3 independent experiments were combined. (C) Eating analysis of 5- to 10-dpf offspring from Ka0Kb1 parents. The numbers at the top are the number of larvae tested. It was noted that eating in Ka0Kb0 larvae was reduced. The black arrowheads in the right panels indicate the food inside the gut of the larvae. (D) Hematoxylin and eosin staining of paraffin sections of 7-dpf larvae. In the right panel, the larval digestive tract is indicated with red dotted lines, and vertical sections at the locations of the esophagus (e, green line), the esophagus-gut junction (j), and the intestinal bulb (i) are shown on the left panel. Scale bars, 50 μm. (E) Alcian blue staining of head cartilages of 7-dpf larvae. (F) Survival rates of offspring from Ka0Kb1 parents without feeding. Survival was observed every 24 h from 6 to 11 dpf. The tested numbers were as follows: Ka0Kb2 n = 18, Ka0Kb1 n = 40, Ka0Kb0 n = 18. The asterisks indicate significant differences (**p < 0.01). (For interpretation of the references to colour in this figure legend, the reader is referred to the Web version of this article.) |

Effects of the Nrf2 mutation on the phenotypes of keap1a;keap1b-DKO zebrafish. (A) Survival rates of offspring from Ka0Kb1N1 parents at 7, 14, 21, and 28 dpf. The red, pink, and lavenderblush bars represent Ka0Kb0N2, Ka0Kb0N1, and Ka0Kb0N0 larvae, respectively. N0, N1, and N2 designate homozygous, heterozygous, and wild-type of the Nrf2 mutant (nfe2l2afh318), respectively. (B) Survival rates of 3- to 6-mpf offspring from Ka0Kb1N1 parents. Data from 3 independent experiments were combined. (C) Eating analysis of offspring from Ka0Kb1N1 parents at 8 dpf. Data from 3 independent experiments were combined. (D) Survival rates of offspring from Ka1Kb0N1 parents without feeding. The survival was observed every 24 h from 6 to 11 dpf. The tested numbers were as follows: Ka0Kb0N2 n = 5, Ka0Kb0N1 n = 25, Ka0Kb0N0 n = 11. The asterisks indicate significant differences (**p < 0.01). (For interpretation of the references to colour in this figure legend, the reader is referred to the Web version of this article.) PHENOTYPE:
|

Upregulation of Nrf2-target genes in keap1a;keap1b-DKO larvae. (A) WISH analysis of gstp1.2 expression in 5-dpf offspring from Ka0Kb1N1 parents. The arrowhead indicates the gill. The numbers in each picture indicate the numbers of larvae with similar staining profiles and tested larvae. (B) qRT-PCR analysis of the relative expressions of gstp1.2, prdx1, txn, and gss in wild-type, Ka0Kb0N2, and Ka0Kb0N0 larvae at 5 dpf. The expression of the wild-type specimens was normalized to 1. Asterisks indicate significant differences (*p < 0.05, **p < 0.01). EXPRESSION / LABELING:
PHENOTYPE:
|
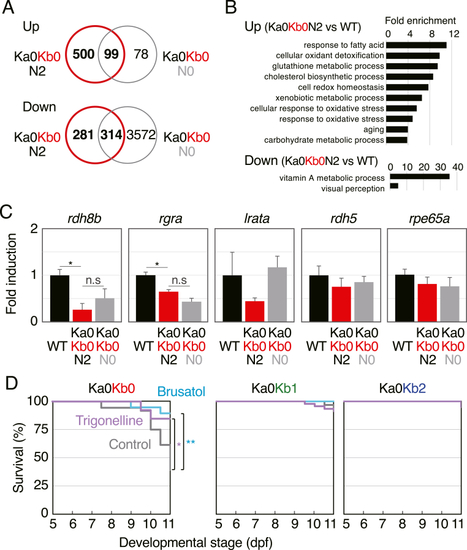
RNA-seq and the effects of Nrf2 inhibitors. (A) Venn diagrams showing upregulated and downregulated genes in 5-dpf Ka0Kb0N2 and Ka0Kb0N0 larvae identified by means of RNA-seq in comparison with wild-type larvae. (B) GO enrichment analysis of the biological processes in keap1a;keap1b-DKO larvae. (C) qRT-PCR analysis of the relative expression of visual cycle genes (rdh8b, rgra, lrata, rdh5, and rpe65a) in wild-type, Ka0Kb0N2, and Ka0Kb0N0 larvae at 5 dpf. Asterisk and n.s. denote significant difference (*p < 0.05) and not significant, respectively. For rpe65a, lrata, and rdh5, one-way analysis of variance did not show significant differences. (D) Survival rates of offspring from Ka0Kb1 parents without feeding. Larvae were treated without (control, gray) or with 0.3 μM trigonelline (purple) or 0.3 μM brusatol (turquoise blue) from 5 to 11 dpf (replaced every 2 days). The tested numbers were as follows: brusatol n = 19, trigonelline n = 13, control n = 36 (Ka0Kb0); brusatol n = 39, trigonelline n = 45, control n = 63 (Ka0Kb1); brusatol n = 19, trigonelline n = 20, control n = 26 (Ka0Kb2). Asterisks indicate significant differences (*p < 0.05, **p < 0.01). (For interpretation of the references to colour in this figure legend, the reader is referred to the Web version of this article.) |