
- Title
-
EVA1A (Eva-1 Homolog A) Promotes Endothelial Apoptosis and Inflammatory Activation Under Disturbed Flow Via Regulation of Autophagy
- Authors
- Canham, L., Sendac, S., Diagbouga, M.R., Wolodimeroff, E., Pirri, D., Tardajos Ayllon, B., Feng, S., Souilhol, C., Chico, T.J.A., Evans, P.C., Serbanovic-Canic, J.
- Source
- Full text @ Arterio., Thromb., and Vas. Bio.
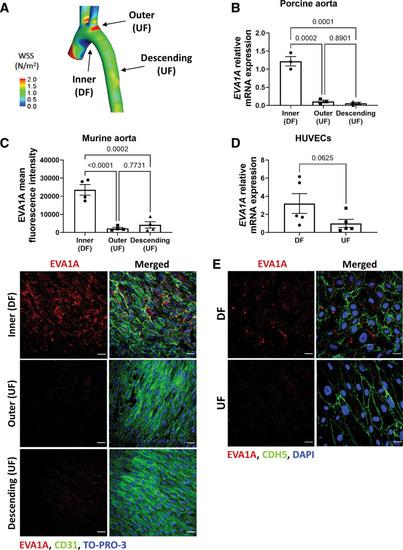
EVA1A (eva-1 homolog A) is induced by proatherogenic shear stress in pig, mouse, and human endothelial cells (ECs). A, Map of time-averaged wall shear stress in the porcine aorta. The regions of undisturbed flow (UF) and disturbed flow (DF) are indicated by arrows. Adapted from Serbanovic-Canic et al.32 B, ECs were isolated from the inner curvature of the porcine aortic arch (DF site), outer curvature of the aortic arch (UF site), and the descending aorta (UF site). The mRNA expression of EVA1A was quantified in each cell population by quantitative real-time polymerase chain reaction (qRT-PCR; n=3 pigs) and normalized to housekeeping gene B2M. C, Aortas were isolated from 8-wk-old C57BL/6 mice (n=4 mice) and en face immunostaining was performed using anti-EVA1A antibody (C, red) in the inner and outer curvature of the aortic arch and the descending aorta. The endothelium was stained with anti-CD31 antibody (C, green) and nuclei costained with TO-PRO-3 (C, blue). The analyzed data was from a minimum of 3 fields of view per animal per aortic location. The graph in C represents EVA1A mean fluorescence intensity (n=4 mice). D and E, Human umbilical vein EC (HUVECs) were cultured under flow for 72 h using the orbital shaker model. D, Cells were isolated from DF (center of the well) and UF (periphery of the well) regions and EVA1A mRNA expression levels were measured by qRT-PCR (n=5 donors). EVA1A expression was normalized to housekeeping gene HPRT. E, Protein levels and cellular localization of EVA1A were assessed by immunostaining using anti-EVA1A antibody (red), EC marker cadherin 5 (CDH5, green), and costaining of nuclei (DAPI [4′,6-diamidino-2-phenylindole], blue; n=3 donors). B, C, and D, Data are presented as means±SE of the mean. Differences between groups were analyzed using 1-way ANOVA with Tukey posthoc test (B and C) and Wilcoxon sum rank test (D). P values are shown in the graphs. Scale bar: (C), 40 µm; (D), 20 µm. |
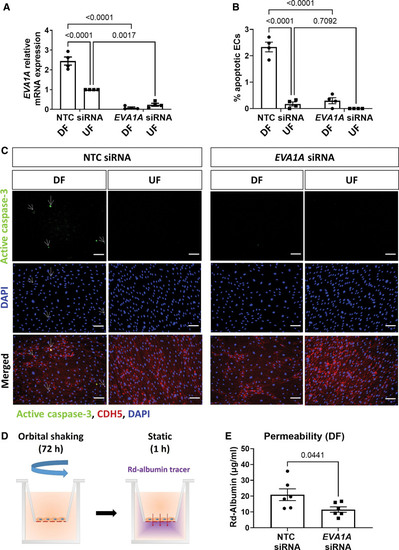
EVA1A (eva-1 homolog A) promotes endothelial apoptosis under proatherogenic disturbed flow. A through C, Human umbilical vein endothelial cells (HUVECs) were treated with EVA1A siRNA (small interfering RNA) or with nontargeting control (NTC) siRNA before exposing to flow for 72 h using the orbital shaker system. A, ECs were isolated from disturbed flow (DF) and undisturbed flow (UF) regions and the efficiency of EVA1A siRNA was assessed by quantitative real-time polymerase chain reaction (qRT-PCR; n=4 donors) using HPRT as a housekeeping gene. EVA1A relative expression was normalized to UF NTC siRNA. B and C, EC apoptosis under DF and UF was assessed by immunostaining using antiactive caspase 3 antibody (C, green) and costaining with EC marker CDH5 (cadherin 5; C, red) and DAPI (4′,6-diamidino-2-phenylindole; C, blue). Apoptotic ECs are indicated with white arrows. The graph in B represents percentage of apoptotic ECs calculated by dividing the number of active caspase 3-positive cells by the total number of EC per field of view (n=4 donors). D and E, HUVECs were treated with EVA1A siRNA or with nontargeting control (NTC) siRNA and cultured on transwell inserts. ECs were exposed to DF for 72 h using the orbital shaker system before assessment of endothelial permeability under static conditions for 1 h using rhodamine (Rd)-albumin as a tracer. The graph in E represents concentration of Rd-albumin measured in the lower compartment (n=6). A, B, and E, Data are presented as means±SEM. Differences between groups were analyzed using a 2-way ANOVA (A and B) with Tukey post hoc test or unpaired t test (E) and P values are shown in the graphs. Scale bar: (C), 100 µm. |
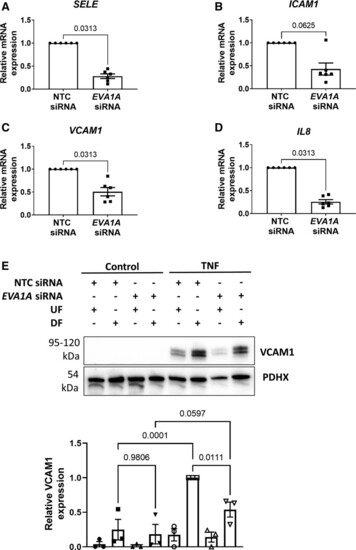
EVA1A (eva-1 homolog A) promotes endothelial permeability and inflammatory activation under disturbed flow. A through E, Human umbilical vein endothelial cells (HUVECs) were treated with EVA1A siRNA (small interfering RNA) or with nontargeting control (NTC) siRNA before exposing to flow for 72 h using the orbital shaker system. A through D, ECs were isolated from the disturbed flow (DF) region, and mRNA expression of E-selectin (SELE), intercellular adhesion molecule 1 (ICAM1), vascular cell adhesion molecule (VCAM1), and interleukin 8 (IL8) were measured by quantitative real-time polymerase chain reaction (qRT-PCR; n=6), using HPRT as a housekeeping gene. E, ECs were stimulated with TNF (tumor necrosis factor; 10 ng/mL) for the last 4 h of flow. VCAM1 protein expression was assessed in TNF-stimulated and nonstimulated (control) ECs isolated from the DF and undisturbed flow (UF) regions by Western blotting. Graph shows VCAM1 protein levels normalized to PDHX (pyruvate dehydrogenase complex component X; n=3). A through E, Data are presented as means±SEM and normalized to control. Differences between groups were analyzed using a nonparametric Wilcoxon test (A–D) or a 2-way ANOVA with Tukey post hoc test (E). P values are shown in the graphs. |
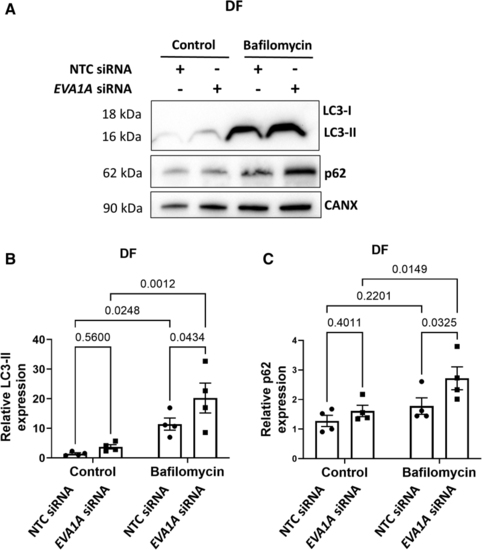
EVA1A reduces autophagic flux under disturbed flow. A through C, Human umbilical vein endothelial cells (HUVECs) were treated with EVA1A siRNA (small interfering RNA) or with nontargeting control (NTC) siRNA before exposing them to flow for 72 h using the orbital shaker system. To block autophagic flux, ECs were treated with 50 nM bafilomycin for the last 4 h of flow exposure. Control cells were treated with 0.05% dimethyl sulfoxide (DMSO). ECs were isolated from the disturbed flow (DF) region and expression levels of autophagy markers LC3-II (microtubule-associated protein 1 light chain 3-II) and p62 were assessed by Western blotting. Calnexin was used as a loading control. B and C, Graphs show protein levels of LC3-II and p62 normalized to CANX (calnexin; n=4). Data are presented as means±SE of the mean. Differences between groups were analyzed using a 2-way ANOVA (B and C) with Tukey post hoc test and P values are shown in the graphs. |
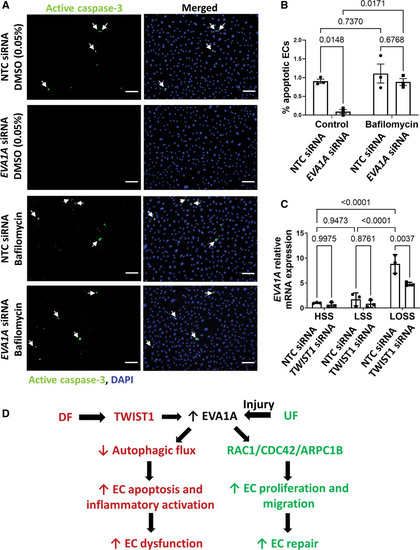
EVA1A (eva-1 homolog A) promotes endothelial apoptosis via regulation of autophagy. A and B, Human umbilical vein endothelial cells (HUVECs) were treated with EVA1A siRNA (small interfering RNA) or with nontargeting control (NTC) siRNA before exposing to flow for 72 h using the orbital shaker system. To block autophagic flux, ECs were treated with 50 nM bafilomycin for the last 4 h of flow exposure. Control cells were treated with 0.05% dimethyl sulfoxide (DMSO). EC apoptosis under disturbed flow (DF) was assessed by immunostaining using antiactive caspase 3 antibody (A, green) and costaining of nuclei with DAPI (4′,6-diamidino-2-phenylindole; A, blue). Apoptotic ECs are indicated with white arrows. The graph in B represents percentage of apoptotic ECs calculated by dividing the number of active caspase 3–positive cells by the total number of ECs per field of view (n=3). C, Human aortic ECs (HAECs) were treated with TWIST1 (twist basic helix-loop-helix transcription factor 1) siRNA or with NTC siRNA before exposing to flow for 72 h using the ibidi parallel plate system. The ECs were exposed to either high laminar shear stress (HSS) of 13 dynes/cm2, low laminar shear stress (LSS) of 4 dynes/cm2, or low oscillatory shear stress (LOSS) of 4 dynes/cm2 with 1 Hz oscillations. Expression of EVA1A mRNA was measured by quantitative real-time polymerase chain reaction (qRT-PCR; n=3 donors), using HPRT as a housekeeping gene. B and C, Data are presented as means±SE of the mean and normalized to control (C). Differences between groups were analyzed using a 2-way ANOVA with Tukey post hoc test and P values are shown in the graphs. D, A schematic diagram summarizing proposed mechanism of how EVA1A (Continued )Figure 5 Continued. regulates endothelial function under different hemodynamic conditions. Under DF conditions, EVA1A expression is upregulated in ECs and contributes to the DF-induced reduction in autophagic flux, leading to increased EC apoptosis and inflammatory activation, which results in EC dysfunction and lesion development (this study). EVA1A expression can also be induced in injured ECs under undisturbed flow (UF) conditions, where it promotes EC repair by regulating EC proliferation and migration via RAC1/CDC42/ARPC1B (rac family small GTPase 1/cell division cycle 42/actin-related protein 2/3 complex subunit 1B) pathway (study by Li et al20). Scale bar: (A), 100 µm. |
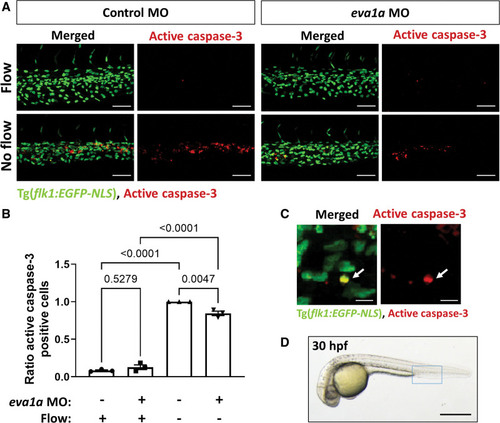
EVA1A (eva-1 homolog A) promotes endothelial apoptosis in vivo in zebrafish. A, Zebrafish embryos (transgenic flk1:EGFP-NLS embryos; green endothelial cell [EC] nuclei) were injected with morpholino oligonucleotide (MO) targeting eva1a or a nontargeting control MO. EC apoptosis was studied in the presence (control MO, flow) or in the absence (silent heart [sih] MO, no flow) of flow by whole-mount active caspase 3 staining (red). Apoptotic ECs (yellow) were monitored at 30 h postfertilisation (hpf). Lateral view, anterior to the left, dorsal up. B, The proportion of apoptotic ECs (number of apoptotic ECs divided by the total number of ECs) normalized to sih MO-injected embryos was calculated, and mean values are shown with SEM. Each data point represents an independent experiment with n≥5 embryos. Differences between groups were analyzed using a 2-way ANOVA with Tukey post hoc test and P values are shown in the graph. C, A high magnification image of EC apoptosis in a sih MO-injected embryo; white arrow indicates an apoptotic EC (yellow). D, Zebrafish embryo at 30 hpf. The region outlined with blue box represents the region that is studied in A. Scale bars: (A), 50 µm; (C), 10 µm; (D), 500 µm. |