
- Title
-
Behavioral and Sensory Deficits Associated with Dysfunction of GABAergic System in a Novel shank2-Deficient Zebrafish Model
- Authors
- Wang, Y., Liu, C., Deng, J., Xu, Q., Lin, J., Li, H., Hu, M., Hu, C., Li, Q., Xu, X.
- Source
- Full text @ Int. J. Mol. Sci.

ZFIN is incorporating published figure images and captions as part of an ongoing project. Figures from some publications have not yet been curated, or are not available for display because of copyright restrictions. |
|
ZFIN is incorporating published figure images and captions as part of an ongoing project. Figures from some publications have not yet been curated, or are not available for display because of copyright restrictions. PHENOTYPE:
|
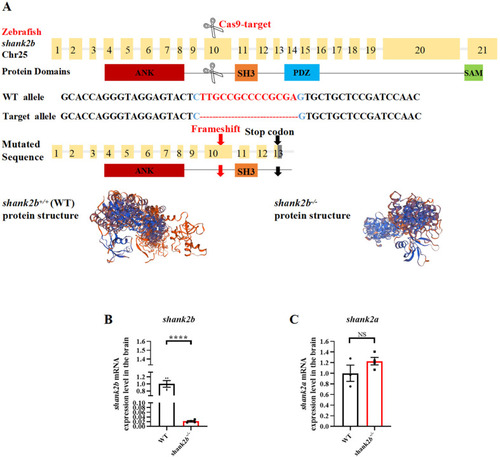
Generation of a zebrafish shank2b mutant using CRISPR/Cas9. (A) Structure of zebrafish shank2b gene and protein. The protein domains (ANK, ankyrin repeat domain; SH3, Src homology 3 domain; PDZ, PSD-95/Discs large/ZO-1 domain; SAM, sterile alpha motif domain) are aligned to the corresponding exons. Diagram of target site on 10th exon of zebrafish shank2b genomic DNA and a 14 bp deletion mutation by CRISPR/Cas9 gene editing. Predicted structures of wild-type (WT) and shank2b mutant proteins in zebrafish. The 14 bp deletion resulted in a stop codon on 13th exon and premature termination before the PDZ and SAM domains. (B) Reduced expression of shank2b mRNA in the brain of shank2b−/− adult male zebrafish at 4.5 months post-fertilization (mpf) compared to WT fish, analyzed by RT-qPCR (WT n = 4, shank2b−/− n = 4, **** p < 0.0001, Student’s t test). Data are shown as mean ± SEM. (C) The expression of shank2a mRNA in the brain of WT and shank2b−/− adult (4.5 mpf) male zebrafish was not affected (WT n = 3, shank2b−/− n = 4, ns, p = 0.1957, Student’s t test). Data are shown as mean ± SEM. |
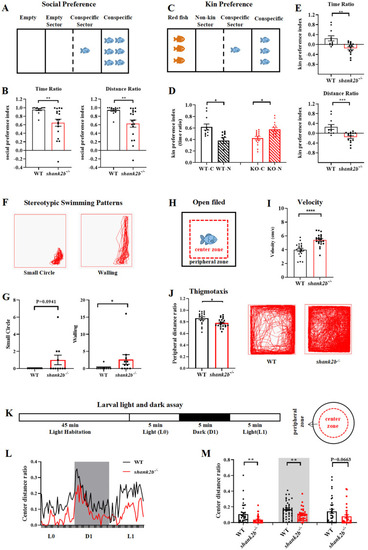
The shank2b−/− deficient zebrafish displayed autism-like behaviors. (A) Schematic diagram of the social preference test of adult male zebrafish. (B) The shank2b−/− zebrafish displayed a significantly reduced preference for conspecifics compared to WT (time ratio, ** p = 0.0063; distance ratio, ** p = 0.0057; WT, n = 12, shank2b−/−, n = 18, Student’s t test). Data are shown as mean ± SEM. (C) Schematic diagram of the kin preference test of adult male zebrafish. (D) The shank2b−/− zebrafish significantly preferred spending time exploring non-kin sector to interact with red fish (n = 15, * p = 0.0278, paired t test), whereas WT zebrafish preferred conspecifics (n = 11, * p = 0.0498, paired t test). (E) In addition, the mutants displayed a significantly reduced kin preference index compared to WT zebrafish (time ratio, ** p = 0.0018; distance ratio, *** p = 0.007; Student’s t test). Data are shown as mean ± SEM. (F) The stereotyped swimming patterns in zebrafish are shown as “small circle” and “walling”. ( |
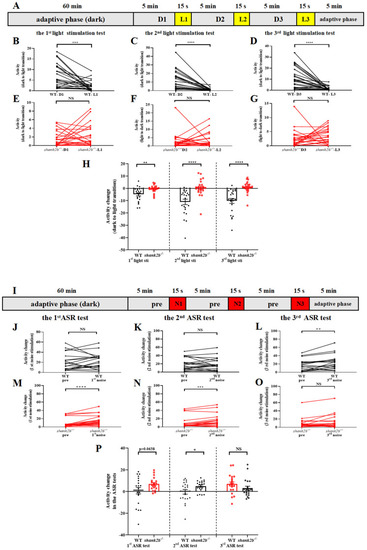
Abnormal response to visual and auditory stimuli in shank2b larva. (A) Scheme and behavioral setup applied for locomotor activity tracking in VMR response to light stimulation of zebrafish larvae at 13 dpf. The experiment consisted of a 60-min adaptation period under continuous dark and a 20 min 45 s testing period consisting of three VMR. The VMR experiment consisted of 5 min of conditioning to darkness and 15 s of stimulation by a sudden light stimulus. (B–D) WT larvae at 13 dpf exhibited normal decrease in response to sudden light stimuli (1st light stimuli, *** p = 0.0006; 2nd light stimuli, **** p < 0.0001; 3rd light stimuli, **** p < 0.0001. n = 23, paired t test), (E–G) whereas shank2b−/− models showed completely different response during dark–light transitions, characterized by dynamic slight increases in activity without statistical significance (1st light stimuli, ns p = 0.3395; 2nd light stimuli, ns p = 0.7621; 3rd light stimuli, ns p = 0.3446. n = 24, paired t test). (H) Column plots compare activity detected during the 1 min before and the 15 s after each light stimulation exposure between WT and shank2b mutants. Each transition from dark to light induced significant difference in activity change between WT and shank2b larva (1st light stimuli, ** p = 0.0029; 2nd light stimuli, **** p < 0.0001; 3rd light stimuli, **** p < 0.0001. WT, n = 23, shank2b−/− n = 24, Student’s t test). Data are presented as the mean ± SEM. (I) Scheme and behavioral setup applied for locomotor activity tracking in AMR response to loud noise stimulation of zebrafish larvae at 13 dpf. The experiment consisted of a 60 min adaptation period and a 20 min 45 s testing period consisting of three AMR tests. An AMR experiment consisted of 5 min of conditioning to ambient sound and 15 s of stimulation by a sudden loud noise. (J–L) WT larvae at 13 dpf exhibited a significant and robust increase in activity induced by the third exposure to the sudden noise stimulus after twice being exposed to ASR assays (1st noise stimuli, ns p = 0.8148; 2nd noise stimuli, ns p = 0.8905; 3rd noise stimuli, ** p = 0.0028. n = 20, paired t test). (M–O) The first and second noise stimuli induced significant increase in activity of shank2b−/− larvae (1st noise stimuli, **** p < 0.0001; 2nd noise stimuli, *** p = 0.0003; 3rd noise stimuli, ns, p = 0.1257. n = 20, paired t test). (P) Column plots compare activity detected during the 1 min before and the 15 s after each loud noise stimulation exposure between WT and shank2b mutants. Similarly, in first two sudden loud noise stimulations, the velocity change of shank2b larva at 13 dpf was more dramatic than that of the WT larvae (1st noise stimuli, p = 0.0638; 2nd noise stimuli, * p = 0.0369; 3rd dark noise, ns p = 0.1645. WT n = 20, shank2b−/− n = 20, Student’s t test). Data are presented as the mean ± SEM. PHENOTYPE:
|
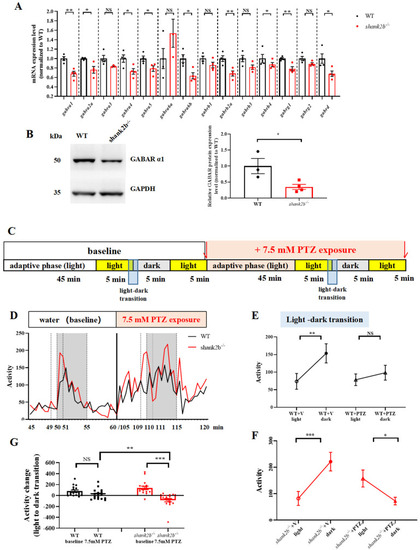
The shank2b mutants display GABAergic deficits. (A) RT-qPCR showed altered expression levels of GABAR subunits in adult shank2b−/− brain tissue. gabra1, ** p = 0.003; gabra2a, * p = 0.0394; gabra3 ns p = 0.0993; gabra3 ns p = 0.0660; gabra4, * p = 0.0341; gabra5, * p = 0.0371; gabrg2 ns p = 0.0730; gabra6a ns p = 0.3488; gabra6b, * p = 0.0138; gabrb1 ns p = 0.1258; gabrb2a, ** p = 0.0083; gabrg1, ** p = 0.005; gabrd, * p = 0.0318; n = 3–4 for each group. Student’s t test. Data are presented as the mean ± SEM. (B) Western blot analysis of GABA A receptor α1 protein in adult shank2b−/− brain tissue. * p = 0.0313, WT n = 3, shank2b−/− n = 4, Student’s t test. Data are presented as the mean ± SEM. (C) Pentylenetetrazol (PTZ)-treated behavior experimental procedure. (D) The experiment consisted of basal activity change during light to dark transition and 7.5 mM PTZ-treated induced activity change exposure to the same basal experiment. (E) WT larva at 9 dpf exhibited a dynamic increase of activity during light–dark transitions (WT + v (vector) light vs. WT + v dark, ** p = 0.0022,; n = 17, paired t test). Remarkably, PTZ concentrations of 7.5 mM of WT larva at 9 dpf did not elict a decline in activity (WT + PTZ light vs. WT + PTZ dark, ns, p = 0.3869, n = 17, paired t test). (F) However, 7.5 mM PTZ elicited a decline in activity of shank2b mutants (shank2b−/− + V light vs. shank2b−/− + V dark, *** p = 0.0005; shank2b−/− + PTZ light vs. shank2b−/− + PTZ dark, * p = 0.0157; n = 16, paired t test). (G) Interestingly, the activity change of shank2b larvae at 9 dpf after 7.5 mM PTZ treatment was more than the activity change before PTZ treatment (shank2b−/− − baseline vs. shank2b−/− + PTZ, *** p = 0.0006, n = 16, paired t test), and even greater than the activity change after WT larvae treated with PTZ (WT + PTZ vs. shank2b−/− + PTZ, ** p = 0.0096, WT + PTZ n = 17, shank2b−/−+ PTZ n = 16 Student’s t test). Remarkably, WT larva at 9 dpf did not have significant difference in the activity change during light–dark transition before and after 7.5 mM PTZ treatment (WT-baseline vs. WT + PTZ, ns p = 0.0961, n = 17, paired t test). |
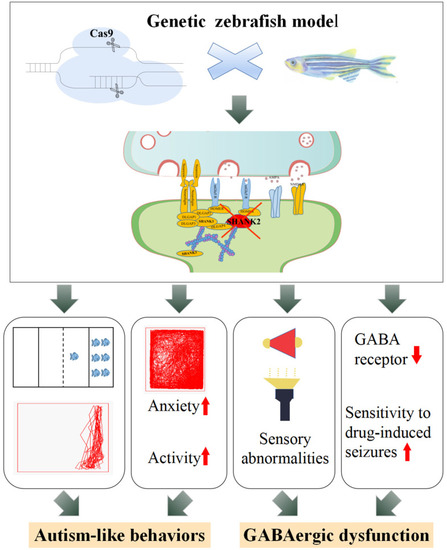
Potential mechanisms for regulation of GABAergic system in the shank2-deficient zebrafish model. |