FIGURE

Figure 2

ID
ZDB-FIG-230217-123
Publication
Wang et al., 2023 - Behavioral and Sensory Deficits Associated with Dysfunction of GABAergic System in a Novel shank2-Deficient Zebrafish Model
Other Figures
All Figure Page
Back to All Figure Page
Figure 2

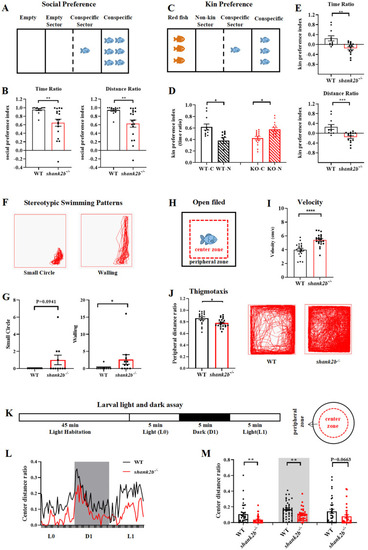
The shank2b−/− deficient zebrafish displayed autism-like behaviors. (A) Schematic diagram of the social preference test of adult male zebrafish. (B) The shank2b−/− zebrafish displayed a significantly reduced preference for conspecifics compared to WT (time ratio, ** p = 0.0063; distance ratio, ** p = 0.0057; WT, n = 12, shank2b−/−, n = 18, Student’s t test). Data are shown as mean ± SEM. (C) Schematic diagram of the kin preference test of adult male zebrafish. (D) The shank2b−/− zebrafish significantly preferred spending time exploring non-kin sector to interact with red fish (n = 15, * p = 0.0278, paired t test), whereas WT zebrafish preferred conspecifics (n = 11, * p = 0.0498, paired t test). (E) In addition, the mutants displayed a significantly reduced kin preference index compared to WT zebrafish (time ratio, ** p = 0.0018; distance ratio, *** p = 0.007; Student’s t test). Data are shown as mean ± SEM. (F) The stereotyped swimming patterns in zebrafish are shown as “small circle” and “walling”. (G) The shank2b−/− zebrafish at 4 mpf exhibited a trend of higher frequency of “small circle” stereotyped behavior (p = 0.0941) and significant increase in “walling” stereotyped behavior (* p = 0.0284), Mann–Whitney test. (H) Schematic diagram of the open field test. (I) The velocity of shank2b mutant at 2 mpf, quantified by average distance moved per one second over 30 min in this test, was increased compared to that of WT zebrafish (WT n = 20, shank2b−/− = 22, **** p < 0.0001, Student’s t test). Data are shown as mean ± SEM. (J) Representative traces of individual WT and shank2b−/− zebrafish at 2 mpf in the thigmotaxis test. The shank2b−/− zebrafish tended to stay in the center area so that distance ratio of thigmotaxis was decreased significantly (WT n = 18, shank2b−/− = 22, * p = 0.0104, Student’s t test). Data are shown as mean ± SEM. (K) Light and dark experimental setup for analysis of larvae at 7 days post-fertilization (dpf). (L) The horizontal axis denotes the time period of the alternating light and dark conditions. The vertical axis shows the ratio of distance moved in the center ring. (M) Under illumination, the shank2b−/− larvae at 7 dpf exhibited a significant decrease during L0 period and a trend of decrease during L1 period. The results also showed significant decrease under dark condition (D1) compared to WT larvae. L0 (left), ** p = 0.0036; D1 (middle), ** p = 0.0033; L1, p = 0.0663. WT larvae n = 36, shank2b−/− larvae n = 34. Student’s t test. Data are shown as mean ± SEM.

Expression Data

Expression Detail
Antibody Labeling
Phenotype Data

Phenotype Detail
Acknowledgments
This image is the copyrighted work of the attributed author or publisher, and ZFIN has permission only to display this image to its users. Additional permissions should be obtained from the applicable author or publisher of the image. Full text @ Int. J. Mol. Sci.