
- Title
-
Endoderm-derived islet1-expressing cells differentiate into endothelial cells to function as the vascular HSPC niche in zebrafish
- Authors
- Nakajima, H., Ishikawa, H., Yamamoto, T., Chiba, A., Fukui, H., Sako, K., Fukumoto, M., Mattonet, K., Kwon, H.B., Hui, S.P., Dobreva, G.D., Kikuchi, K., Helker, C.S.M., Stainier, D.Y.R., Mochizuki, N.
- Source
- Full text @ Dev. Cell
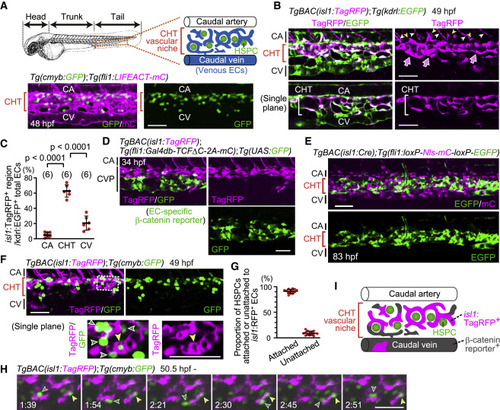
Figure 1. isl1 lineage ECs mostly contribute to the vascular HSPC niche in the CHT (A) Representative confocal images of the tail of a Tg(cmyb:GFP);Tg(fli1:LIFEACT-mCherry) embryo (48 hpf). cmyb:GFP+ HSPCs are located in the CHT. Images displayed in all the figures are 3D-rendered confocal images of a stack unless otherwise noted. Lateral views, anterior to the left. Confocal images in all the figures are representative of at least three independent experiments. (B) Tail of a TgBAC(isl1:TagRFP);Tg(kdrl:EGFP) embryo (49 hpf). Upper, projection view; lower, single plane of the upper panel. In the caudal vasculature marked by EGFP expression, isl1:TagRFP expression is mainly found in venous ECs in the CHT (arrows). isl1:TagRFP+ cells around the CA are not arterial ECs but CHT-derived venous intersegmental vessels (vISVs) (yellow arrowheads) and motor neurons (white arrowheads). (C) Quantitative analysis of the data shown in (B). Graph shows the percentage of the volume of isl1:TagRFP+ voxels among the whole EC volume (kdrl:EGFP+ voxels) in the CA, CHT, and CV at 49–50 hpf. Each ROI was set as explained in Figure S1I. Data are mean ± SD. Each dot represents an individual embryo in this and the following graphs unless otherwise described. The number of embryos analyzed is indicated at the top. (D) Tail of a TgBAC(isl1:TagRFP);Tg(fli1:Gal4db-TCFΔC-2A-mCherry);Tg(UAS:GFP) embryo (34 hpf). Of note, GFP+ cells rarely express isl1:TagRFP and vice versa. (E) Tail of a TgBAC(isl1:Cre);Tg(fli1:loxP-Nls-mCherry-loxP-EGFP) embryo (83 hpf). Cre-driven EGFP expression in ECs is mainly detected in the CHT. (F) Tail of a TgBAC(isl1:TagRFP);Tg(cmyb:GFP) embryo (49 hpf). Upper, projection view; lower, single plane of the boxed area. Most cmyb:GFP+ HSPCs (green arrowheads) are found adjacent to isl1:RFP+ ECs in the CHT; yellow arrowheads point to a single cmyb:GFP+ HSPC surrounded by isl1:RFP+ ECs. (G) Graph shows the percentage of cmyb:GFP+ HSPCs attached or unattached to isl1:RFP+ ECs among all the cmyb:GFP+ HSPCs in the CHT. Data are mean ± SD (n = 13). (H) Time-sequential images of a TgBAC(isl1:TagRFP);Tg(cmyb:GFP) embryo (from 50.5 hpf). Elapsed time (h:min). In the CHT, cmyb:GFP+ HSPCs stay adjacent to isl1:RFP+ ECs (yellow arrowheads) or migrate toward other isl1:RFP+ ECs (green arrowheads). (I) Schematic representation of the CHT and caudal vessels. Scale bars, 50 μm. CHT, caudal hematopoietic tissue; HSPC, hematopoietic stem and progenitor cell; CA, caudal artery; CV, caudal vein; CVP, caudal vein plexus. See also Figure S1 and Video S1. |
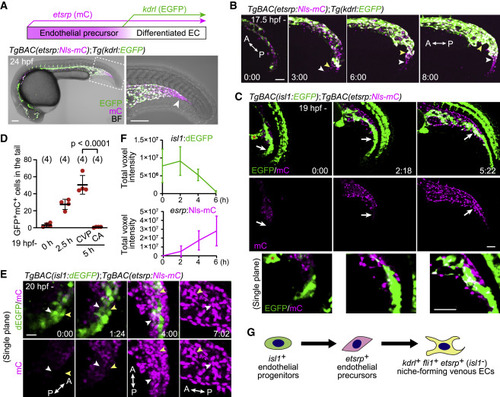
Figure 2. Identification of isl1+ endothelial progenitors as a source of ECs in the CHT (A) Visualization of etsrp:mCherry+ endothelial precursors (magenta) and their differentiation into kdrl:EGFP+ ECs (green, upper). TgBAC(etsrp:Nls-mCherry);Tg(kdrl:EGFP) embryo at 24 hpf (lower). The boxed area is enlarged on the right. mCherry single-positive endothelial precursors are observed in the most posterior region of the tail (arrowhead). (B) Time-sequential images of a TgBAC(etsrp:Nls-mCherry);Tg(kdrl:EGFP) embryo (from 17.5 hpf). Elapsed time (h:min). etsrp:mCherry+ endothelial precursors in the most posterior region of the tail differentiate into kdrl:EGFP+ ECs (arrowheads point to individual cells). (C) Time-sequential images of a TgBAC(isl1:EGFP);TgBAC(etsrp:Nls-mCherry) embryo (from 19 hpf). Elapsed time (h:min). Top and middle, projection view images; bottom, enlarged single confocal plane images of the regions pointed to by arrows. isl1:EGFP+ cells on the ventral side of the tail that do not initially express etsrp:mCherry differentiate into etsrp:mCherry+ endothelial precursors (arrows). isl1:EGFP is also detected in the presumptive cloaca (red asterisk) and neural tube. (D) Quantitative analysis of the data shown in (C). The number of isl1:GFP/etsrp:Nls-mCherry double-positive cells in the ventral region of the tail was counted at the indicated time (from 19 hpf). The double-positive cells were separately counted in the CA and the CVP only at 5 h because the CA and the CVP are indistinguishable until then (i.e., 24 hpf). Data are mean ± SD. (E) Time-sequential images of a TgBAC(isl1:dEGFP);TgBAC(etsrp:Nls-mCherry) embryo (from 20 hpf). Single confocal planes that contain the two tracked cells (white and yellow arrowheads) are shown. (F) Quantitative analysis of the data shown in (E). Time trace of the total voxel intensity of isl1:dEGFP or etsrp:Nls-mCherry in the ventral region of the tail. Data are mean ± SD (n = 3). (G) Schematic of differentiation of isl1+ endothelial progenitors. isl1+ endothelial progenitors exclusively differentiate into caudal venous ECs via etsrp+ endothelial precursors. Scale bars, 50 μm. BF, bright field; A, anterior; P, posterior. See also Figure S2 and Videos S2, S3, and S4. |
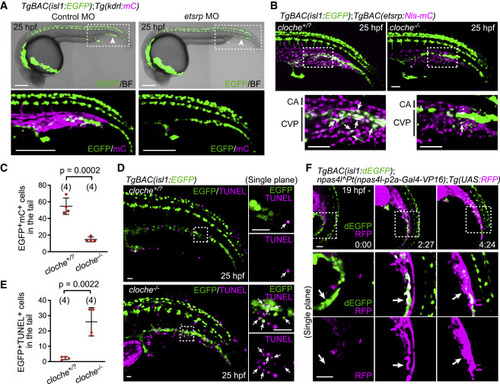
Figure 3. The Npas4l (Cloche)-Etsrp axis is required for the differentiation of isl1+ endothelial progenitors into ECs (A) TgBAC(isl1:EGFP);Tg(kdrl:mCherry) embryos (25 hpf) injected with control morpholino oligonucleotide (MO) or etsrp MO. The boxed areas are enlarged (bottom). Arrowheads point to ventral isl1:EGFP+ cells in the tail. (B) TgBAC(isl1:EGFP);TgBAC(etsrp:Nls-mCherry) cloche+/? and cloche−/− sibling embryos (25 hpf). The boxed areas are enlarged (bottom). isl1:EGFP+ cells (arrows) rarely express etsrp:mCherry in cloche mutants. (C) Quantitative analysis of the data shown in (B). Number of isl1:EGFP/etsrp:mCherry double-positive cells in the tail of cloche+/? and cloche−/− sibling embryos. Data are mean ± SD. (D) TgBAC(isl1:EGFP) cloche+/? and cloche−/− sibling embryos (25 hpf) subjected to TUNEL staining. The boxed areas are enlarged on the right. Arrows point to isl1:EGFP/TUNEL double-positive cells. (E) Quantitative analysis of the data shown in (D). Number of isl1:EGFP/TUNEL double-positive cells in the tail of cloche+/? and cloche−/− sibling embryos. Data are mean ± SD. (F) Time-sequential images of a TgBAC(isl1:dEGFP);npas4lPt(npas4l-p2a-Gal4-VP16);Tg(UAS:RFP) embryo (from 19 hpf). Top, projection view; middle and bottom, single confocal planes of the boxed areas. isl1:dEGFP+ cells start to express npas4l:RFP and lose isl1:dEGFP expression (arrows). Scale bars: 200 μm in (A), 50 μm in (B) and (F), and 20 μm in (D). See also Figure S3. |
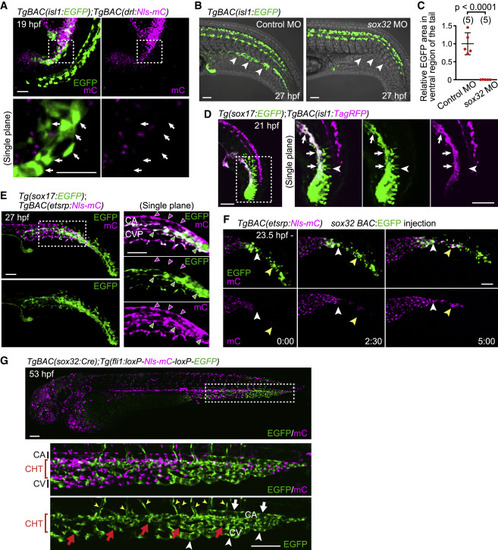
Figure 4. The isl1+ endothelial progenitors do not originate from the lateral plate mesoderm but from cells expressing sox32 and sox17 (A) TgBAC(isl1:EGFP);TgBAC(drl:Nls-mCherry) embryo (19 hpf). Upper, projection view; lower, single confocal plane of the boxed area. isl1:EGFP+ cells (arrows) do not express drl:mCherry. (B) TgBAC(isl1:EGFP) embryos (27 hpf) injected with control MO or sox32 MO. Ventral isl1:EGFP+ cells are not detected in sox32 morphants (arrowheads). (C) Quantitative analyses of the data shown in (B). EGFP area in the ventral region of the tail in embryos injected with sox32 MO relative to that in embryos injected with control MO as shown in Figure S5B. Data are mean ± SD. (D) Tg(sox17:EGFP);TgBAC(isl1:TagRFP) embryo (21 hpf). Left, projection view; right, single confocal plane of the boxed area. Arrows point to sox17:EGFP/isl1:TagRFP double-positive cells. Arrowheads point to sox17:EGFP single-positive notochord cells. (E) Tg(sox17:EGFP);TgBAC(etsrp:Nls-mCherry) embryo (27 hpf). Left, projection view; right, single plane of the boxed area. sox17:EGFP expression in the CVP (green arrowheads) but not in the CA (magenta arrowheads). (F) Time-sequential images in the tail of TgBAC(etsrp:Nls-mCherry) (from 23.5 hpf) injected with sox32 BAC:EGFP plasmid that drives EGFP expression under the control of a sox32 BAC promoter in a mosaic manner. sox32:EGFP+ cells differentiate into etsrp:mCherry+ endothelial precursors (arrowheads point to individual cells). (G) TgBAC(sox32:Cre);Tg(fli1:loxP-Nls-mCherry-loxP-EGFP) embryo (53 hpf). The boxed area is enlarged (middle and bottom). Cre-driven EGFP expression in ECs is restricted to the tail, especially in the CHT (red arrows) and CHT-derived vISVs (yellow arrowheads). In the most posterior end, it is found in almost all ECs including the CA (white arrowhead), CHT (red arrows), and CV (white arrows). Scale bars: 50 μm in (A), (B), and (D)–(F) and 100 μm in (G). See also Figure S4. |
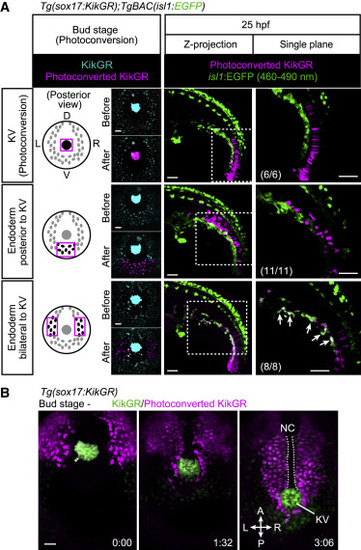
Figure 5. The isl1+ endothelial progenitors derive from endodermal cells (A) Tg(sox17:KikGR);TgBAC(isl1:EGFP) embryos at bud stage (10 hpf) photoconverted in the KV (upper) or in endodermal cells posterior to the KV (middle) or lateral to the KV (lower) as indicated on the left. Left, posterior views at bud stage; middle and right, lateral views at 25 hpf. Arrows point to photoconverted cells expressing isl1:EGFP. EGFP fluorescence can be separated by 460–490 nm range of emission filter as in Figures S4J and S4K. Left and middle, projection views; right, single confocal planes. The number of embryos analyzed in each case is indicated in the right panels. (B) Time-sequential confocal images of a Tg(sox17:KikGR) embryo (from the bud stage) just after KikGR was photoconverted in endodermal cells located lateral to the KV. Posterior view. Scale bars, 50 μm. KV, Kupffer’s vesicle; D, dorsal; V, ventral; L, left; R, right. See also Figure S4 and Videos S5 and S6. |
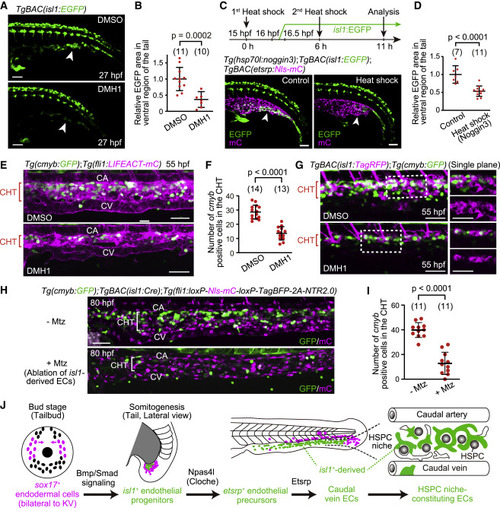
Figure 6. isl1+ endothelial progenitors are specified by Bmp-Smad signaling and constitute the vascular HSPC niche (A) TgBAC(isl1:EGFP) embryos treated with DMSO or DMH1 at 15 hpf (i.e., in advance of isl1:EGFP expression [16–16.5 hpf]) and observed 12 h after the treatment. The number of isl1:EGFP+ cells in the tail is markedly decreased by DMH1 treatment (arrowheads). (B) Quantitative analysis of the data shown in (A). isl1:EGFP area in the ventral region of the tail in embryos treated with DMH1 relative to that in embryos treated with DMSO. EGFP area is measured as in Figure S5B. Data are mean ± SD. (C) Tg(hsp70l:noggin3);TgBAC(isl1:EGFP);TgBAC(etsrp:Nls-mCherry) embryos without (control) or subjected to heat shock twice (upper, schematic illustration). The number of isl1:EGFP+ cells in the tail is markedly decreased by Noggin3 overexpression (arrowheads). (D) Quantitative analysis of the data shown in (C). isl1:EGFP area as in (B) in the heat-shocked embryos relative to that in embryos without heat shock. Data are mean ± SD. (E) Tail of Tg(cmyb:GFP);Tg(fli1:LIFEACT-mCherry) embryos (55 hpf) treated with DMSO or DMH1 for 12 h starting at 15 hpf. (F) Number of cmyb:GFP+ cells in the CHT regions of DMSO- or DMH1-treated embryos (54–55 hpf), as observed in (E). Data are mean ± SD. (G) Tail of TgBAC(isl1:TagRFP);Tg(cmyb:GFP) embryos (55 hpf) treated with DMSO or DMH1 for 12 h starting at 15 hpf as in (E). Left, projection view; right, single planes of the boxed areas. (H) Tail of TgBAC(isl1:Cre);Tg(fli1:loxP-Nls-mCherry-loxP-TagBFP-2A-NTR2.0) larvae (80 hpf) treated with or without Mtz for 24 h starting at 35 hpf. (I) Number of cmyb:GFP+ cells in the CHT regions of larvae (80–81 hpf) treated with or without Mtz, as observed in (H). Data are mean ± SD. (J) Schematic representation of the development of caudal vein ECs from sox17+ endodermal cells. Scale bars, 50 μm. See also Figure S5. |
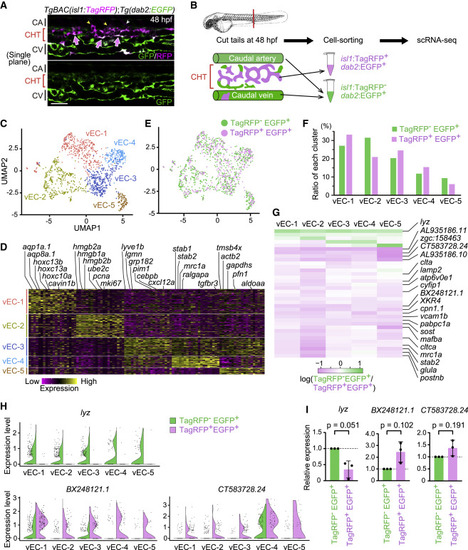
Figure 7. Transcriptomic heterogeneity and specialization in isl1-derived venous ECs constituting the vascular HSPC niche (A) Single confocal plane of the tail of a TgBAC(isl1:TagRFP);Tg(dab2:EGFP) embryo (48 hpf). Isl1:TagRFP+/dab2:EGFP+ cells are mostly present in venous ECs of the CHT (arrows). Isl1:TagRFP expression is also detected in the vISVs (yellow arrowheads) and motor neurons (white arrowhead). (B) Experimental design for scRNA-seq from the tail of TgBAC(isl1:TagRFP);Tg(dab2:EGFP) embryos. (C) Uniform manifold approximation and projection (UMAP) visualization of tail venous ECs corresponding to the venous EC cluster in Figure S6. Reclustered cells are color-coded for the 5 identified sub-clusters. (D) Heatmap illustrating the expression of the top-ranking marker genes enriched in each sub-cluster. Representative gene names are shown on top. (E) Mapping of isl1:TagRFP−/dab2:EGFP+ cells (772 cells: green) and isl1:TagRFP+/dab2:EGFP+ cells (449 cells: pink) into the UMAP shown in (C). (F) Percentage contribution of isl1:TagRFP−/dab2:EGFP+ cells and isl1:TagRFP+/dab2:EGFP+ cells to each venous EC sub-cluster. (G) Heatmap illustrating the log-count expression, log2(gene expression in isl1:TagRFP− EGFP+/gene expression in isl1:TagRFP+ dab2:EGFP+), of the 36 differentially expressed genes between isl1:TagRFP−/dab2:EGFP+ cells and isl1:TagRFP+/dab2:EGFP+ cells (q value < 0.05 in at least one sub-cluster). (H) Violin plots of the representative result of three genes; lyz, BX248121.1, and CT583728.24 in (G). The expression of lyz is dominant in isl1:TagRFP−/dab2:EGFP+ over isl1:TagRFP+ dab2:EGFP+ cells, whereas that of BX248121.1 and CT583728.24 is dominant in isl1:TagRFP+ dab2:EGFP+ cells over isl1:TagRFP−/dab2:EGFP+ cells. (I) isl1:TagRFP−/dab2:EGFP+ cells and isl1:TagRFP+/dab2:EGFP+ cells were isolated from the tail of TgBAC(isl1:TagRFP);Tg(dab2:EGFP) embryos at 48 hpf by fluorescence-activated cell sorting (FACS). Relative expression of lyz mRNA, BX248121.1 mRNA, and CT583728.24 mRNA in FACS-sorted cells was analyzed by quantitative PCR. Data are normalized to the values in isl1:TagRFP−/dab2:EGFP+ cells (fold change = 2(−ΔΔCt)). Data are mean ± SD. Each dot represents an individual experiment (n = 3 independent experiments). Scale bars, 50 μm. See also Figure S6 and Tables S1 and S2. |
Reprinted from Developmental Cell, 58(3), Nakajima, H., Ishikawa, H., Yamamoto, T., Chiba, A., Fukui, H., Sako, K., Fukumoto, M., Mattonet, K., Kwon, H.B., Hui, S.P., Dobreva, G.D., Kikuchi, K., Helker, C.S.M., Stainier, D.Y.R., Mochizuki, N., Endoderm-derived islet1-expressing cells differentiate into endothelial cells to function as the vascular HSPC niche in zebrafish, 224-238.e7, Copyright (2023) with permission from Elsevier. Full text @ Dev. Cell