
|
Fig. 1
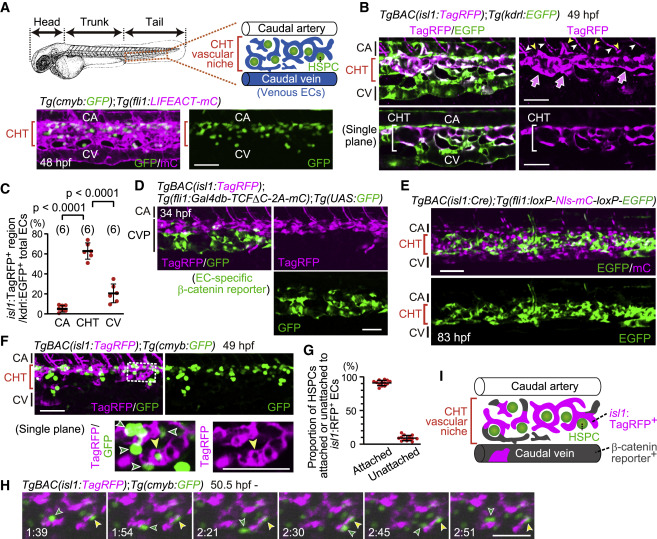
Figure 1. isl1 lineage ECs mostly contribute to the vascular HSPC niche in the CHT (A) Representative confocal images of the tail of a Tg(cmyb:GFP);Tg(fli1:LIFEACT-mCherry) embryo (48 hpf). cmyb:GFP+ HSPCs are located in the CHT. Images displayed in all the figures are 3D-rendered confocal images of a stack unless otherwise noted. Lateral views, anterior to the left. Confocal images in all the figures are representative of at least three independent experiments. (B) Tail of a TgBAC(isl1:TagRFP);Tg(kdrl:EGFP) embryo (49 hpf). Upper, projection view; lower, single plane of the upper panel. In the caudal vasculature marked by EGFP expression, isl1:TagRFP expression is mainly found in venous ECs in the CHT (arrows). isl1:TagRFP+ cells around the CA are not arterial ECs but CHT-derived venous intersegmental vessels (vISVs) (yellow arrowheads) and motor neurons (white arrowheads). (C) Quantitative analysis of the data shown in (B). Graph shows the percentage of the volume of isl1:TagRFP+ voxels among the whole EC volume (kdrl:EGFP+ voxels) in the CA, CHT, and CV at 49–50 hpf. Each ROI was set as explained in Figure S1I. Data are mean ± SD. Each dot represents an individual embryo in this and the following graphs unless otherwise described. The number of embryos analyzed is indicated at the top. (D) Tail of a TgBAC(isl1:TagRFP);Tg(fli1:Gal4db-TCFΔC-2A-mCherry);Tg(UAS:GFP) embryo (34 hpf). Of note, GFP+ cells rarely express isl1:TagRFP and vice versa. (E) Tail of a TgBAC(isl1:Cre);Tg(fli1:loxP-Nls-mCherry-loxP-EGFP) embryo (83 hpf). Cre-driven EGFP expression in ECs is mainly detected in the CHT. (F) Tail of a TgBAC(isl1:TagRFP);Tg(cmyb:GFP) embryo (49 hpf). Upper, projection view; lower, single plane of the boxed area. Most cmyb:GFP+ HSPCs (green arrowheads) are found adjacent to isl1:RFP+ ECs in the CHT; yellow arrowheads point to a single cmyb:GFP+ HSPC surrounded by isl1:RFP+ ECs. (G) Graph shows the percentage of cmyb:GFP+ HSPCs attached or unattached to isl1:RFP+ ECs among all the cmyb:GFP+ HSPCs in the CHT. Data are mean ± SD (n = 13). (H) Time-sequential images of a TgBAC(isl1:TagRFP);Tg(cmyb:GFP) embryo (from 50.5 hpf). Elapsed time (h:min). In the CHT, cmyb:GFP+ HSPCs stay adjacent to isl1:RFP+ ECs (yellow arrowheads) or migrate toward other isl1:RFP+ ECs (green arrowheads). (I) Schematic representation of the CHT and caudal vessels. Scale bars, 50 μm. CHT, caudal hematopoietic tissue; HSPC, hematopoietic stem and progenitor cell; CA, caudal artery; CV, caudal vein; CVP, caudal vein plexus. See also Figure S1 and Video S1.
Reprinted from Developmental Cell, 58(3), Nakajima, H., Ishikawa, H., Yamamoto, T., Chiba, A., Fukui, H., Sako, K., Fukumoto, M., Mattonet, K., Kwon, H.B., Hui, S.P., Dobreva, G.D., Kikuchi, K., Helker, C.S.M., Stainier, D.Y.R., Mochizuki, N., Endoderm-derived islet1-expressing cells differentiate into endothelial cells to function as the vascular HSPC niche in zebrafish, 224-238.e7, Copyright (2023) with permission from Elsevier. Full text @ Dev. Cell