
- Title
-
ahctf1 and kras mutations combine to amplify oncogenic stress and restrict liver overgrowth in a zebrafish model of hepatocellular carcinoma
- Authors
- Morgan, K.J., Doggett, K., Geng, F., Mieruszynski, S., Whitehead, L., Smith, K.A., Hogan, B.M., Simons, C., Baillie, G.J., Molania, R., Papenfuss, A.T., Hall, T.E., Ober, E.A., Stainier, D.Y.R., Gong, Z., Heath, J.K.
- Source
- Full text @ Elife
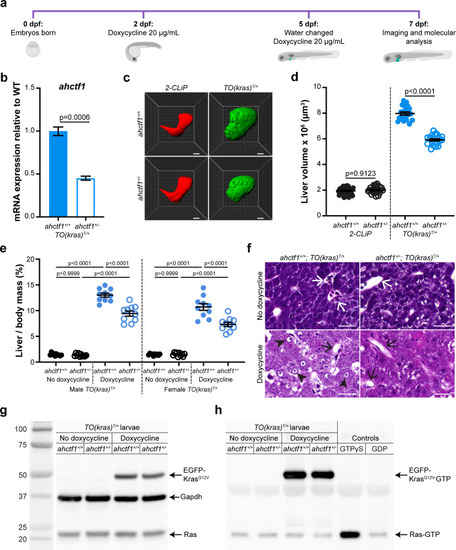
(a) Protocol used to induce TO(krasG12V)T/+ expression in the livers of developing zebrafish larvae. (b) RT-quantitative PCR (RT-qPCR) analysis of ahctf1 mRNA levels in pooled micro-dissected larval livers (n = 3 biological replicates). (c) Representative three-dimensional reconstructions of 2-CLiP and dox-treated TO(krasG12V)T/+ larval livers of the indicated ahctf1 genotype. Scale bar 25 µm. (d) Impact of ahctf1 heterozygosity on liver volume in 2-CLiP and TO(krasG12V)T/+ larvae (n ≥ 20). (e) Impact of ahctf1 heterozygosity on liver-to-body mass ratio of adult TO(krasG12V)T/+ zebrafish in the presence or absence of dox treatment (n = 10). (f) Histological sections of adult male TO(krasG12V)T/+ zebrafish livers of the indicated ahctf1 genotype and dox treatment, stained with haematoxylin and eosin. In vehicle-treated adults, hepatocytes are densely packed and well differentiated. White arrows point to sections through blood vessels containing red blood cells. Meanwhile, the hepatocytes in dox-treated animals are poorly differentiated and exhibit multiple cytological abnormalities, including pyknotic nuclei (arrowheads) and vacuolation (black arrows). Scale bar 25 µm. (g) Western blot of Ras and Gapdh protein signals in total input lysates (50 μg) of TO(krasG12V)T/+ larvae of the indicated ahctf1 genotype and dox treatment. (h) Western blot of active Ras-GTP protein signals in lysates following active Ras pull-down.
|

(a) Representative Airyscan imaging of liver sections stained with mAb414 (white) marking FG-NUPs, Hoechst 33342 (cyan) marking DNA, and rhodamine phalloidin (magenta) marking the F-actin cytoskeleton in non-TO(krasG12V)-expressing cells and EGFP-KrasG12V (magenta) marking the cell membrane in dox-treated TO(krasG12V)-expressing cells of the indicated ahctf1 and TO(krasG12V) genotypes. Arrows in right-hand panel point to mAb414/FG-nucleoporin staining in the cytoplasm. Scale bar 2 µm. (b) Quantification of mean nuclear/cytoplasmic fluorescence intensity of mAb414 staining after 3D segmentation and morphological filtering of nuclear and cytoplasmic areas (n > 18). (c) Representative Airyscan images of mAb414 staining at the nuclear surface of sections of the indicated ahctf1 and TO(krasG12V) genotype. Scale bar 1 µm. (d) Quantification of nuclear pore density (n ≥ 25). (e) Quantification of nuclear volume (n ≥ 25). Data are expressed as mean ± standard error of the mean (SEM). Significance was assessed using a one-way analysis of variation (ANOVA) with Tukey’s multiple comparisons test.
|
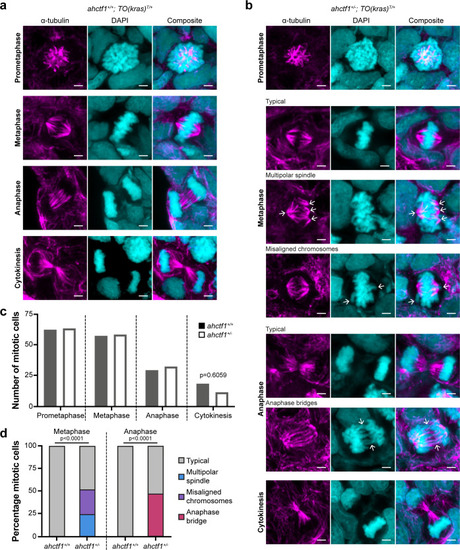
(a) Representative Airyscan imaging of liver cryosections stained with α-tubulin antibody (magenta) marking spindle microtubules and DAPI (cyan) marking DNA in mitotic cells of TO(krasG12V)T/+ larvae on a wildtype ahctf1+/+ background. (b) Mitotic cells in liver cryosections of TO(krasG12V)T/+ larvae that are heterozygous for ahctf1+/− exhibit multiple defects, including multipolar spindles, misaligned chromosomes, and anaphase bridges (arrows). Scale bar 2 µm. (c) Distribution of cells observed at different mitotic stages (n = 92 livers, 326 mitotic cells). (d) Quantification of the percentage of mitotic hepatocytes exhibiting an aberrant phenotype (n = 14–57). Significance was assessed using a Chi-square test.
|
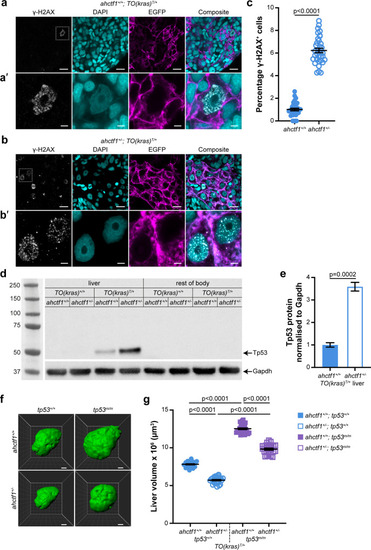
(a) Representative Airyscan imaging of cryosections of liver from dox-treated ahctf1+/+;TO(krasG12V)T/+ larvae stained with γ-H2AX antibody (white) marking DNA double-strand breaks, DAPI (cyan) marking DNA and EGFP-KrasG12V (magenta) marking the cell membrane. Scale bar 5 µm. (a’) Inset of γ-H2AX-positive nuclei in ahctf1+/+;TO(krasG12V)T/+ hepatocytes. Scale bar 2 µm. (b) Representative images of cryosections of liver from dox-treated ahctf1+/−;TO(krasG12V)T/+ larvae. Scale bar 5 µm. (b’) Inset of γ-H2AX-positive nuclei in cryosections of liver from ahctf1+/−;TO(krasG12V)T/+ larvae. Scale bar 2 µm. (c) Quantification of the percentage of hepatocytes positive for γ-H2AX (n ≥ 31). (d) Representative western blot of Tp53 protein signals in lysates of TO(krasG12V) larvae of the indicated ahctf1 genotype. (e) Quantification of Tp53 protein levels normalised by reference to the Gapdh loading control (n = 3 independent experiments). (f) Representative three-dimensional reconstructions of dox-treated TO(krasG12V)T/+ livers of the indicated ahctf1 and tp53 genotypes. Scale bar 25 µm. (g) Impact of ahctf1 heterozygosity and homozygous tp53 mutation on liver volume in 2-CLiP and TO(krasG12V)T/+ larvae (n ≥ 20). Data are expressed as mean ± standard error of the mean (SEM). Significance was calculated using a Student’s t-test or one-way analysis of variation (ANOVA) with Tukey’s multiple comparisons test.
|
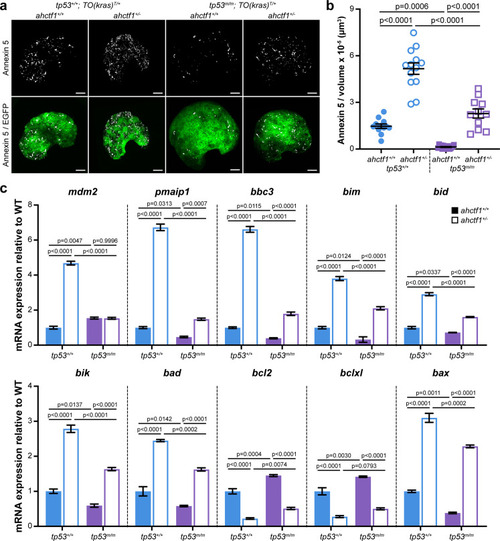
(a) Representative maximum intensity projection images of Annexin 5-mKate fluorescence (white puncta), indicating cells undergoing apoptosis in TO(krasG12V)T/+ livers of the indicated ahctf1 and tp53 genotypes. Scale bar 25 µm. (b) Quantification of the density of Annexin 5 fluorescent foci in TO(krasG12V)T/+ livers of the indicated ahctf1 and tp53 genotypes (n ≥ 11). (c) RT-quantitative PCR (RT-qPCR) analysis of the specified mRNAs in TO(krasG12V)T/+ micro-dissected livers of the indicated ahctf1 and tp53 genotypes (n = 3 biological replicates). Data are expressed as mean ± standard error of the mean (SEM). Significance was calculated using a one-way analysis of variation (ANOVA) with Tukey’s multiple comparisons test.
|
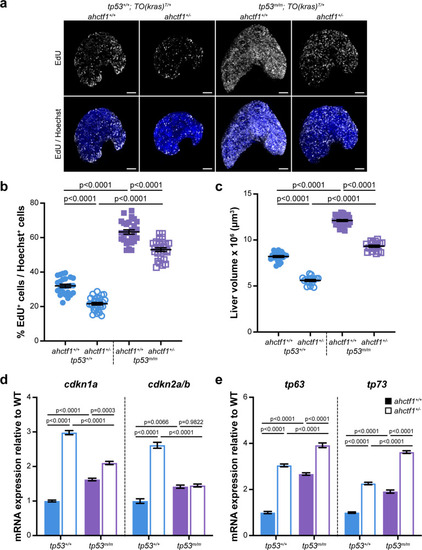
(a) Representative maximum intensity projection images of EdU incorporation (white puncta) into TO(krasG12V)T/+ livers of the indicated ahctf1 and tp53 genotypes. Scale bar 25 µm. (b) Quantification of the percentage of EdU-positive nuclei per Hoechst 33342-positive nuclei (n ≥ 25). (c) Impact of ahctf1 heterozygosity and homozygous tp53 mutation on liver volume in dox-treated TO(krasG12V)T/+ larvae (n ≥ 17). (d) RT-quantitative PCR (RT-qPCR) analysis of mRNA expression of the cell cycle regulators, cdkn1a and cdkn2a/b and (e) tp63 and tp73 expression in TO(krasG12V)T/+ micro-dissected livers of the indicated ahctf1 and tp53 genotypes (n = 3 biological replicates). Data are expressed as mean ± standard error of the mean (SEM). Significance was assessed using a one-way analysis of variation (ANOVA) with Tukey’s multiple comparisons test.
|
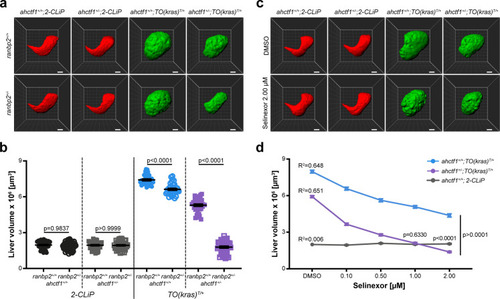
(a) Representative three-dimensional reconstructions of livers from 2-CLiP and TO(krasG12V)T/+ larvae of the indicated ahctf1 and ranbp2 genotypes. Scale bar 25 µm. (b) Impact of ahctf1 heterozygosity and ranbp2 heterozygosity on liver volume in 2-CLiP and TO(krasG12V)T/+ larvae (n ≥ 30). Significance was calculated using a one-way analysis of variation (ANOVA) with Tukey’s multiple comparisons test. (c) Representative three-dimensional reconstructions of TO(krasG12V)T/+ livers of the indicated ahctf1 genotype treated with dimethyl sulfoxide (DMSO) or 2.00 µM Selinexor from 5 to 7 dpf. (d) Dose-dependent impact of Selinexor treatment on liver volume in 2-CLiP, ahctf1+/+;TO(krasG12V)T/+ and ahctf1+/−;TO(krasG12V)T/+ larvae (n ≥ 20). Data are expressed as mean ± standard error of the mean (SEM). Significance was calculated by linear regression analysis.
|

(a) Heatmap based on percentage of hepatocellular carcinoma (LIHC) samples in The Cancer Genome Atlas (TCGA) with mRNA expression levels of NUP107–160 components that are under-expressed (z-score <−2: over 2 standard deviations below the mean expression of those genes in diploid samples) or overexpressed (z-score >2: over 2 standard deviations above the mean expression of those genes in diploid samples) analysed through the cBioPortal for Cancer Genomics (Cerami et al., 2012; Gao et al., 2013). See Figure 8—source data 1. (b) Probability of overall survival of HCC patients linked to samples with mRNA expression z-scores >2 for one or more NUP107–160 complex components (red line; 63 cases); median probability of overall survival 21.70 months. Probability of overall survival of HCC patients linked to samples with mRNA expression z-scores <−2 for one or more NUP107–160 complex components (blue line; 45 cases); median probability of overall survival 81.73 months. (c) Schematic depiction of two cellular processes disrupted by mild Elys depletion, leading to (d) accumulation of DNA damage and activation of Tp53 transcription programmes. (e) Induction of cell death and cell cycle arrest in hyperproliferative oncogene-expressing cancer cells.
|