
|
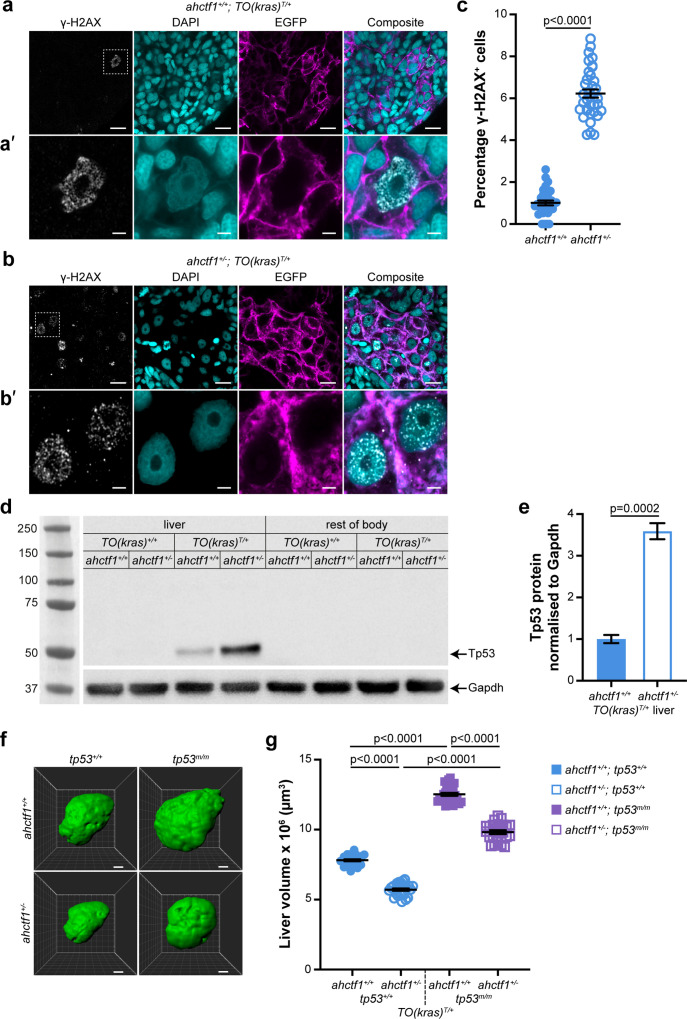
Figure 4
(a) Representative Airyscan imaging of cryosections of liver from dox-treated ahctf1+/+;TO(krasG12V)T/+ larvae stained with γ-H2AX antibody (white) marking DNA double-strand breaks, DAPI (cyan) marking DNA and EGFP-KrasG12V (magenta) marking the cell membrane. Scale bar 5 µm. (a’) Inset of γ-H2AX-positive nuclei in ahctf1+/+;TO(krasG12V)T/+ hepatocytes. Scale bar 2 µm. (b) Representative images of cryosections of liver from dox-treated ahctf1+/−;TO(krasG12V)T/+ larvae. Scale bar 5 µm. (b’) Inset of γ-H2AX-positive nuclei in cryosections of liver from ahctf1+/−;TO(krasG12V)T/+ larvae. Scale bar 2 µm. (c) Quantification of the percentage of hepatocytes positive for γ-H2AX (n ≥ 31). (d) Representative western blot of Tp53 protein signals in lysates of TO(krasG12V) larvae of the indicated ahctf1 genotype. (e) Quantification of Tp53 protein levels normalised by reference to the Gapdh loading control (n = 3 independent experiments). (f) Representative three-dimensional reconstructions of dox-treated TO(krasG12V)T/+ livers of the indicated ahctf1 and tp53 genotypes. Scale bar 25 µm. (g) Impact of ahctf1 heterozygosity and homozygous tp53 mutation on liver volume in 2-CLiP and TO(krasG12V)T/+ larvae (n ≥ 20). Data are expressed as mean ± standard error of the mean (SEM). Significance was calculated using a Student’s t-test or one-way analysis of variation (ANOVA) with Tukey’s multiple comparisons test.
ahctf1 heterozygosity causes DNA damage and accumulation of Tp53 protein in dox-treated TO(krasG12V)T/+ hepatocytes.