
- Title
-
The scaffolding function of LSD1/KDM1A reinforces a negative feedback loop to repress stem cell gene expression during primitive hematopoiesis
- Authors
- Casey, M.J., Call, A.M., Thorpe, A.V., Jette, C.A., Engel, M.E., Stewart, R.A.
- Source
- Full text @ iScience
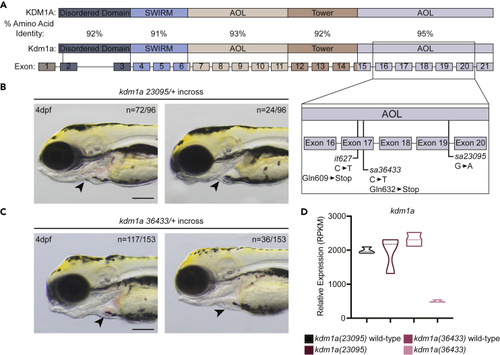
Mutant lsd1 alleles in zebrafish (A) Schematic showing the percent amino acid identity between human and zebrafish Lsd1 as well as the locations of the mutations in the C-terminal AOL region that are relevant to this study. (B and C) Brightfield images of 4-dpf embryos derived from an incross between either kdm1a(23095) heterozygotes (B) or kdm1a(36433) heterozygotes (C). Arrowheads indicate erythrocytes in the heart. The number of animals with a similar phenotype to the representative image, out of the total number of animals visualized, is shown in the top right to indicate Mendelian ratio. Scale bar, 200 μm. (D) The relative mRNA expression levels of kdm1a in mutants and wild-type siblings are shown in the graph. |
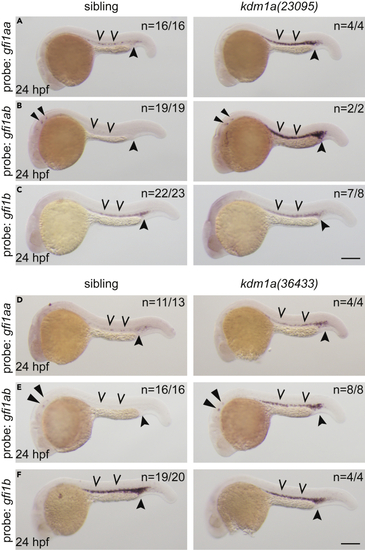
Expression of GFI-family transcription factors are dysregulated in lsd1 mutants (A–F) Whole-mount in situ hybridization (WISH) of embryos derived from an incross of either kdm1a(23095) heterozygotes (A–C) or kdm1a(36433) heterozygotes (D–F) using probes to detect gfi1aa (A and D), gfi1ab (B and E), or gfi1b (C and F), as indicated. Representative images are shown with the number of animals with similar staining patterns for the indicated genotype shown in the upper right corner of each image. The lower left corner indicates the approximate stage of the animal at the time of fixation. Embryos were imaged, blindly scored by expression levels and then genotyped by HRMA. Carons indicate ICM expression; closed arrowheads indicate posterior blood island/caudal hematopoietic tissue; narrow triangles indicate inner-hair-cell expression. Scale bar, 200 μm. |
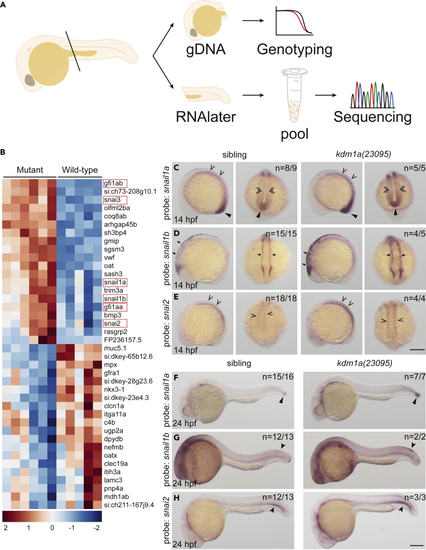
SNAG-domain proteins are dysregulated in lsd1 mutants (A) Schematic of the sample preparation workflow. (B) Heatmap of the top 40 differentially expressed genes in kdm1a(23095) and kdm1a(36433) mutants compared to wild-type siblings. SNAG-domain proteins are boxed. (C–H) WISH of embryos from an incross of kdm1a(23095) heterozygotes for snail1a, snail1b, and snail2 at 14 hpf (C–E), lateral (left) and dorsal (right) views) and 24 hpf (F–H). Representative images are shown with the number of animals with similar staining patterns for the indicated genotype shown in the upper right corner of each image. The lower left corner indicates the approximate stage of the animal at the time of fixation. Embryos were imaged, blindly scored by expression and then genotyped by HRMA. Carons indicate somite expression; narrow triangles indicate tail bud; double carons indicate adaxial cell expression; arrows indicate neural plate border; closed arrowheads indicate trunk neural crest cells (snail1b) or ventral mesoderm (snai2). Scale bar, 200 μm. |
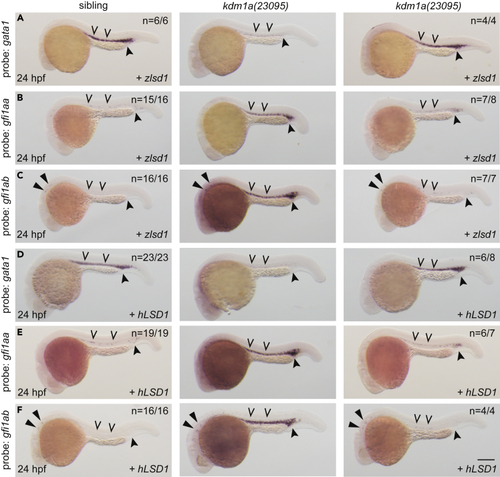
Wild-type lsd1 rescues hematopoietic transcription factor expression (A–F) Single-cell embryos from a kdm1a(23095) heterozygous incross were injected with either zlsd1 (A–C) or hLSD1 mRNA (D–F). At 24 hpf, WISH was performed. Representative images are shown with the number of animals with similar staining patterns for the indicated genotype shown in the upper right corner. The lower right corner indicates the mRNA injection conditions. Uninjected mutant embryos are shown in the middle column for comparison. Embryos were imaged, blindly scored by expression and then genotyped by HRMA. Carons indicate ICM expression; closed arrowheads indicate posterior blood island/caudal hematopoietic tissue; narrow triangles indicate inner-hair-cell expression. Scale bar, 200 μm. |
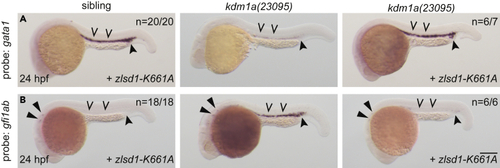
Demethylase-deficient lsd1 rescues hematopoietic transcription factor gene expression (A and B) Single-cell zebrafish embryos from a kdm1a(23095) heterozygous incross were injected with zebrafish zlsd1-K661A. WISH was then performed at 24 hpf for gata1 (A) and gfi1ab (B). Representative images are shown with the number of animals with similar staining patterns for the indicated genotype shown in the upper right corner. The lower right corner indicates the mRNA injection conditions. Uninjected mutant embryos are shown in the middle column for comparison. Embryos were imaged, blindly scored by expression and then genotyped by HRMA. Carons indicate ICM expression; closed arrowheads indicate posterior blood island/caudal hematopoietic tissue; narrow triangles indicate inner-hair-cell expression. Scale bar, 200 μm. |
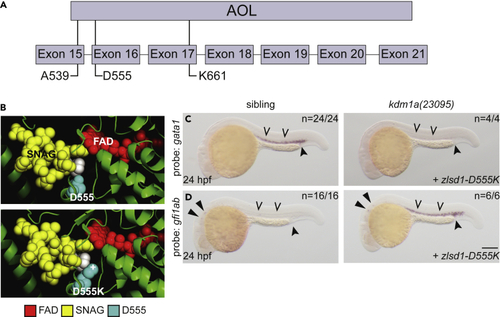
SNAG-binding-deficient lsd1 does not rescue gene expression (A) Schematic of the zebrafish Lsd1 C-terminal AOL domain with exon locations of predicted SNAG-binding-deficient mutations indicated. (B) Top panel: the structure of LSD1 (green) with the FAD moiety (red) and the SNAG domain of SNAIL (yellow) is shown. LSD1 D555 is highlighted in teal. The second proline residue of the SNAG domain is highlighted in white to provide orientation. Bottom panel: the PyMOL mutagenesis feature (PyMOL Molecular Graphics System, Version 2.3.4 Schrodinger, LLC) was utilized to change Asp 555 to Lys. The atom providing positive charge is indicated with a (+) symbol. (C and D) Single-cell zebrafish embryos from a kdm1a(23095) heterozygous incross were injected with mRNA encoding zlsd1-D555K (C and D). WISH was then performed on 24-hpf embryos for gata1 (C) and gfi1ab (D) expression. Representative images are shown with the number of animals with similar staining patterns for the indicated genotype shown in the upper right corner. The lower right corner indicates the mRNA injection conditions. Embryos were imaged, blindly scored by expression and then genotyped by HRMA. Carons indicate ICM expression; closed arrowheads indicate posterior blood island/caudal hematopoietic tissue; narrow triangles indicate inner-hair-cell expression. Scale bar, 200 μm. |
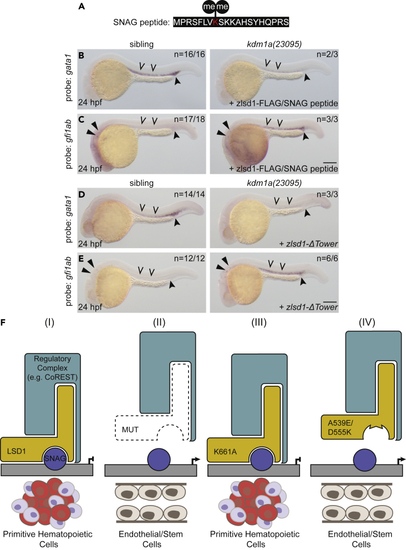
The SNAG-LSD1 interaction is critical for the regulation of primitive hematopoiesis (A) Sequence of the SNAG domain peptide with dimethylated Lys 8 indicated in red. (B and C) Single-cell zebrafish embryos from a kdm1a(23095) heterozygous incross were injected with both zlsd1-3XFLAG mRNA and the SNAG peptide. WISH was then performed at 24 hpf for gata1 (B) and gfi1ab (C) expression. (D and E) Single-cell zebrafish embryos from a kdm1a(23095) heterozygous incross were injected with zlsd1-ΔTower mRNA. WISH was then performed at 24 hpf for gata1 (D) and gfi1ab (E) expression. Representative images are shown with the number of animals with similar staining patterns for the indicated genotype shown in the upper right corner. The lower right corner indicates the mRNA injection conditions. Embryos were imaged, blindly scored by expression and then genotyped by HRMA. Carons indicate ICM expression; closed arrowheads indicate posterior blood island/caudal hematopoietic tissue; narrow triangles indicate inner-hair-cell expression. Scale bar, 200 μm. (F) Model: LSD1-dependent hematopoietic phenotypes require SNAG-domain binding. Under normal conditions, a SNAG-domain protein recruits LSD1 and a regulatory complex (e.g., CoREST) to target specific loci to silence the endothelial/stem program and promote hematopoietic cell differentiation. (II) In the absence of LSD1, SNAG-target loci are not transcriptionally repressed and an endothelial/stem cell fate is permitted. (III) An SNAG-domain protein is still able to recruit a demethylase-deficient LSD1 (K661A) and a regulatory complex to target the genetic loci that enable primitive hematopoietic gene expression. (IV) LSD1 SNAG-domain-binding mutations, such as A539E or D555K, prevent LSD1 from binding SNAG-domain-containing proteins. These LSD1 mutants are therefore not recruited to SNAG-protein target genes, such as endothelial/stem genes, which remain expressed and permit an endothelial/stem cell fate. |