
|
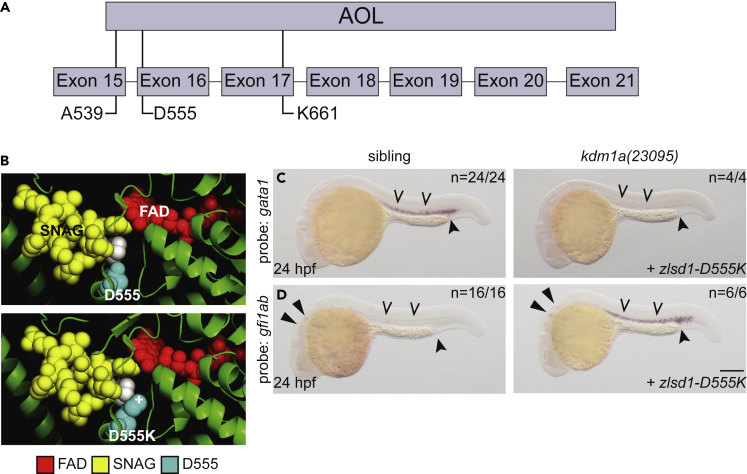
Fig. 6
SNAG-binding-deficient lsd1 does not rescue gene expression
(A) Schematic of the zebrafish Lsd1 C-terminal AOL domain with exon locations of predicted SNAG-binding-deficient mutations indicated.
(B) Top panel: the structure of LSD1 (green) with the FAD moiety (red) and the SNAG domain of SNAIL (yellow) is shown. LSD1 D555 is highlighted in teal. The second proline residue of the SNAG domain is highlighted in white to provide orientation. Bottom panel: the PyMOL mutagenesis feature (PyMOL Molecular Graphics System, Version 2.3.4 Schrodinger, LLC) was utilized to change Asp 555 to Lys. The atom providing positive charge is indicated with a (+) symbol.
(C and D) Single-cell zebrafish embryos from a kdm1a(23095) heterozygous incross were injected with mRNA encoding zlsd1-D555K (C and D). WISH was then performed on 24-hpf embryos for gata1 (C) and gfi1ab (D) expression. Representative images are shown with the number of animals with similar staining patterns for the indicated genotype shown in the upper right corner. The lower right corner indicates the mRNA injection conditions. Embryos were imaged, blindly scored by expression and then genotyped by HRMA. Carons indicate ICM expression; closed arrowheads indicate posterior blood island/caudal hematopoietic tissue; narrow triangles indicate inner-hair-cell expression. Scale bar, 200 μm.