
|
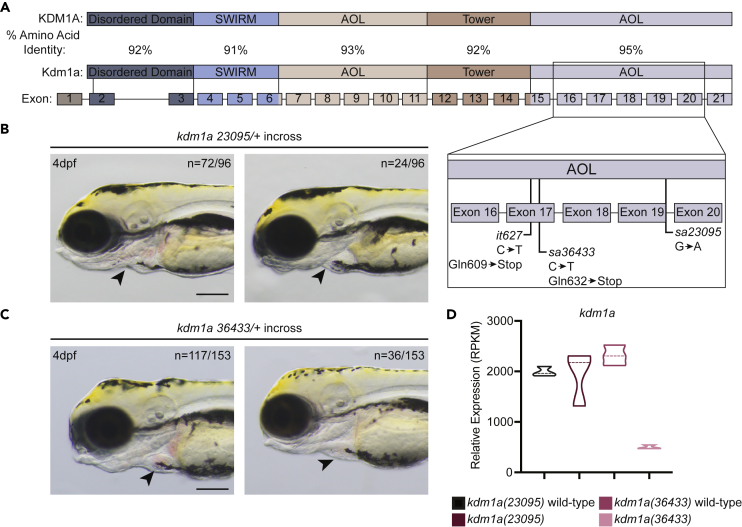
Fig. 1
Mutant lsd1 alleles in zebrafish
(A) Schematic showing the percent amino acid identity between human and zebrafish Lsd1 as well as the locations of the mutations in the C-terminal AOL region that are relevant to this study.
(B and C) Brightfield images of 4-dpf embryos derived from an incross between either kdm1a(23095) heterozygotes (B) or kdm1a(36433) heterozygotes (C). Arrowheads indicate erythrocytes in the heart. The number of animals with a similar phenotype to the representative image, out of the total number of animals visualized, is shown in the top right to indicate Mendelian ratio. Scale bar, 200 μm.
(D) The relative mRNA expression levels of kdm1a in mutants and wild-type siblings are shown in the graph.