
- Title
-
Clonally related, Notch-differentiated spinal neurons integrate into distinct circuits
- Authors
- Bello-Rojas, S., Bagnall, M.W.
- Source
- Full text @ Elife
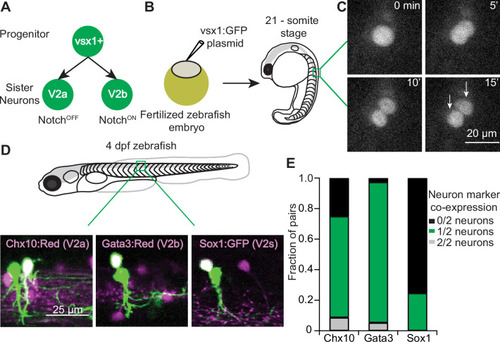
(A) Schematic of vsx1 GFP+ progenitor undergoing a final paired division into sister V2a/b neurons. (B) Schematic of fertilized embryo injection and screening for vsx1 GFP+ progenitors at the 21-somite stage. (C) Time-lapse single-plane confocal images taken every 5 min as a vsx1 GFP+ progenitor divides into two sister neurons, imaged at 24 hr post fertilization (hpf). (D) Confocal imaging of vsx1+ sister neuron pairs in the spinal cord of 4 dpf larvae. Left: vsx1 GFP+ sister pair in a chx10:Red larva. One sister neuron is co-labeled (white, V2a) while the other is a presumed V2b. Middle: vsx1 GFP+ sister pair in a gata3:Red larva showing an identified V2b with a presumed V2a or V2s. Right: vsx1 mCherry+ sister pair in a sox1:GFP larva, showing an identified V2s with a presumed V2b. Colors switched for label and image consistency. (E) Bar graph displaying the fraction of vsx1 GFP+ pairs in chx10:Red (n = 92), gata3:Red (n = 38), and sox1:GFP (n = 65) larvae in which either 0/2 sister neurons were co-labeled with the reporter (black), 1/2 sister neurons were co-labeled (green), or 2/2 sister neurons were co-labeled (gray). Source data for this figure are given in Figure 1—source data 1.
|
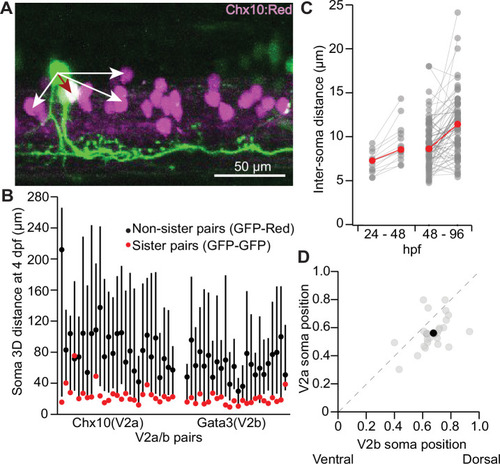
(A) Maximum intensity projection (50 planes, 50 μm) of chx10:Red with a single vsx1 GFP+ clonal pair. The inter-soma distance between the GFP-only sister neuron to the GFP/Red co-labeled V2a neuron (dark red arrow) is smaller than the distance between non-sister neurons (white arrows). (B) For each clonal pair in either the Chx10 reporter line (n = 27) or the Gata3 reporter line (n = 24), the 3D distance between the two sister neurons (GFP-GFP, red) and the median 3D distance between one sister neuron and its non-sister neurons in the same segment (GFP-Red). Black dot indicates median and lines show 5th–95th percentiles. (C) Paired line plot of inter-soma distances of individual vsx1 GFP+ sister pairs first imaged at 24 hr post fertilization (hpf) and later reimaged at 48 hpf (left) (n = 14) or first imaged at 48 hpf and later reimaged at 96 hpf (right) (n = 66). Red values indicate median distances at each time point. (D) Scatterplot of normalized dorsal (1)-ventral (0) soma position for each of 27 sister V2a/b neurons. Dashed line indicates unity. Typically, the V2b neuron was located more dorsally than the V2a neuron. Black dot indicates the median V2a/b pair position. **Wilcoxon signed-rank test, p=5.2 × 10⁻⁴, paired t-test, n = 27 pairs. Source data for this figure are given in Figure 2—source data 1.
|

(A) Confocal image of chx10:Red larva exhibiting a single vsx1 GFP+ clonal pair with long axons in close proximity to each other. Stitched maximum intensity projection over 74 z-planes (74 μm). (B) Scatterplot of sister V2a axon length vs. sister V2b axon length (n = 27) for V2a/b pairs. Heat map depicts the muscle segment number where each clonal pair was located. Black line depicts Pearson correlation, r = 0.32, p=0.10. V2a axons were invariably longer than sister V2b axons, as seen by each pair’s position relative to the unity line (dashed gray). ***Wilcoxon signed-rank test, p=1.9 × 10⁻⁵, paired t-test n = 27 pairs. (C) Histogram of clonal pairs showing the fraction of V2b axon that is within 5 μm of V2a axon. Inset schematic depicts how the distances were measured. Source data for this figure are given in Figure 3—source data 1.
|

(A) Schematic of larval zebrafish whole-cell paired recording (sister V2a in red and sister V2b in blue). (B) Two sister neurons labeled with vsx1:GFP (left), filled with dye during whole-cell recording (right). One neuron co-labels with V2a marker chx10:Red (middle). Red arrow and blue arrow indicate sister V2a and presumed sister V2b, respectively. (C) Example traces during swim of vsx1 GFP+ sister neurons from V2a/b pair in voltage-clamp configuration. Asterisks denote detected excitatory postsynaptic current (EPSC) events. (D) Overlaid detected EPSC events recorded from sister V2a neuron (top) and simultaneously recorded signal in the sister V2b neuron (bottom). Most detected EPSCs in the V2a do not occur synchronously with EPSCs in the V2b neuron. (E) Overlaid detected EPSCs in V2b neuron (top) and simultaneously recorded signal in sister V2a neuron (bottom), also showing very few synchronous EPSCs. Colored traces represent averages of individual traces in gray. (F) Data from one example sister V2a/b pair showing the EPSC amplitude of detected events and the amplitude of the simultaneously recorded signal in the other neuron (Trig). Boxes depict medians, 25th and 75th percentiles. Whiskers denote 10th and 90th percentiles. Open circles depict EPSC values above and below the 10th and 90th percentiles. ***Wilcoxon signed-rank test (V2a – V2b simul.) p=1.8 × 10–206; (V2b – V2a simul.) p=6.7 × 10⁻¹⁵ paired t-test. (G) Summary data from all sister V2a/b pairs of recorded EPSC amplitudes and the EPSC-triggered simultaneously recorded signal in the other neuron. ***Wilcoxon signed-rank test, (V2a – V2b simul.) p=1.6 × 10⁻⁵; (V2b – V2a simul.) p=2.6 × 10⁻⁵ paired t-test, n = 13 pairs from 13 fish. (H) As in (F), for non-sister V2a/b paired recordings from the same spinal segment. ***Wilcoxon signed-rank test, (V2a – V2b simul.) p=1.6 × 10⁻⁵; (V2b – V2a simul.) p=1.3 × 10⁻⁴ paired t-test, n = 13 pairs from 13 fish. Source data for this figure are given in Figure 4—source data 1.
|

(A) Schematic of larval zebrafish whole-cell paired recording. (B) Simultaneous current-clamp and voltage-clamp recording of sister V2a/b neurons. Current step-evoked spiking in sister V2a neuron and simultaneous voltage-clamp recording in V2b (left). Current step-evoked spiking in sister V2b neuron and simultaneous voltage-clamp recording in V2a (right). No synaptic responses are seen in either case. (C) Bar graph showing the number of clonal V2a/b interconnected pairs detected (n = 10 pairs from 10 fish). (D) Bar graph showing the number of V2a/b interconnected pairs detected for non-sister pairs (n = 7 pairs from seven fish).
|

(A) Maximum intensity projection (79 planes, 79 μm) of WT larva with a single vsx1:Gal4;UAS:CoChR2-tdTomato+ clonal pair. (B) Schematic of cell-attached recording of vsx1:Gal4;UAS:CoChR2-tdTomato+ neurons using optical stimulation. (C) Cell-attached example trace of CoChR2+V2a neuron during optical stimulation (top, green) (n = 13 from 12 fish). Cell-attached example trace of nearby CoChR2- neuron during optical stimulation (bottom, black) (n = 22 from 18 fish). Both example traces are aligned to the start of the 10ms optical stimulus (light blue). (D) Averaged detected spike events recorded from an example CoChR2+ sister V2a neuron (top, red), CoChR2+ sister V2b neuron (middle, blue), and absence of response in nearby CoChR2- neuron (bottom, black). (E) Histogram showing the number of spikes relative to the optical stimulus. Blue bar indicates the duration of the optical stimulus. Source data for this figure are given in Figure 6—source data 1.
|

(A) Schematic of whole-cell recording of downstream neuronal targets of vsx1:Gal4;UAS:CoChR2-tdTomato+ neurons using optical stimulation. (B) Example voltage-clamp traces from a target neuron held at Vhold –80 mV or 0 mV during optical stimulation of the upstream sister neuron pair. Optical stimulation evoked excitatory postsynaptic currents (EPSCs) onto the target neuron (top) but not inhibitory postsynaptic currents (IPSCs) (middle), indicating connectivity from the V2a but not the V2b. Bottom: application of glutamatergic antagonists blocks the evoked EPSCs. (C) As in (B) for another target neuron, this one showing evoked IPSCs but not EPSCs. IPSCs were abolished by application of strychnine (bottom). (D) Example voltage-clamp traces from a target neuron held at Vhold –80 mV or 0 mV. Trace showing a small, slow evoked EPSCs without any fast component. These are presumably due to indirect (polysynaptic) electrical connectivity from the optogenetically activated V2a neuron. (E) Mean evoked amplitude of optogenetically evoked EPSCs and IPSCs in each target neuron. 12/14 synaptically connected targets received only EPSCs or IPSCs, while 2/14 neurons received both EPSCs and IPSCs. (F) Bar graph depicting the number of EPSC only (n = 6), IPSC only (n = 6), both EPSC/IPSC (n = 2), and no responses (n = 75) (black) or only slow presumed polysynaptic (gray) (n = 10) detected across all target neurons recorded. (G) Scatterplot showing the distinction between mean evoked amplitude and 20–80% rise time for fast and slow evoked EPSC responses. (H) Schematic depicting the two presumed types of vsx1 GFP+ sister pairs observed. (I) Summary of circuit integration pattern observed among sister V2a/b pairs. Source data for this figure are given in Figure 7—source data 1.
|