
- Title
-
Anp32a Promotes Neuronal Regeneration after Spinal Cord Injury of Zebrafish Embryos
- Authors
- Lee, H.C., Lai, W.L., Lin, C.Y., Zeng, C.W., Sheu, J.C., Chou, T.B., Tsai, H.J.
- Source
- Full text @ Int. J. Mol. Sci.
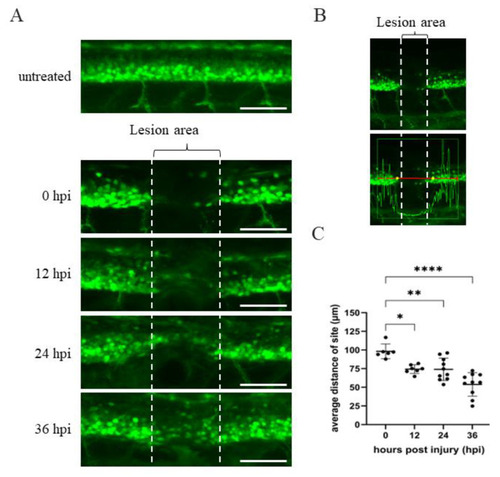
Time course of spinal cord regeneration of Tg(mnx1:GFP) transgenic zebrafish larvae after SCI. (A) Spinal cord located at the 17–20th segment of Tg(mnx1:GFP) embryos at 48 hpf was crushed, causing SCI. Complete loss of motoneuronal connections in the lesion area around the SCI (indicated by two broken lines) occurred at 0 hpi. Then, spinal cord regeneration from 12 to 36 hpi was shown, compared to uninjured spinal cord. (B) Image of SCI-Tg(mnx1:GFP) larvae at 0 hpi used to quantify the length of lesion site (in μm) using Zen 2010b Sp1 software. The box in the lower panel shows a red line 300 μm in length. This indicates the detection area with fluorescent cells located at either side of the SCI site, as marked by the vertical white broken line. While the GFP signal within the box could be detected, its intensity dropped at the SCI site. Indeed, the yellow dots mark the place where the strength of the green fluorescence signal dropped off at both sides of the SCI. The length of yellow dots relative to that of the vertical broken white line was measured. Observed by the naked eye, the length of yellow dots was longer than that of SCI site (white broken line). (C) Statistical analysis of the distance (in μm) between the two yellow dots versus temporal regenerative response (in hpi) in SCI-Tg(mnx1:GFP) embryos. Each dataset was obtained from three independent experiments and represented as mean ± SEM. One-way ANOVA was used to perform statistical analysis (* p < 0.05, ** p < 0.01, **** p < 0.0001; ns: not significant). Scale bar: 100 μm. |

Western blot analysis of ANP32a in zebrafish embryos undergoing either knockdown or overexpression of Anp32a. (A) Diagrams were used to depict base-pairings among Anp32a mRNA, antisense morpholino oligonucleotides (MO) of Anp32a (Anp32a-MO) and wobble nucleotides of Anp32a-flag mRNA (wobble-Anp32a-flag mRNA). (B) Western blot analysis. Zebrafish embryos at one-cell stage were microinjected with Anp32a-MO (MO), wobble-Anp32a-flag mRNA (wb-RNA) and MO plus wobble mRNA (MO + wb-RNA) as indicated, followed by extraction of total embryonic proteins at 48 hpf. Protein levels of endogenous ANP32a and exogenous ANP32a-flag were detected using antibodies against ANP32a and reporter protein flag. α-tubulin served as an internal control. Protein levels relative to each internal control are presented below each lane. |

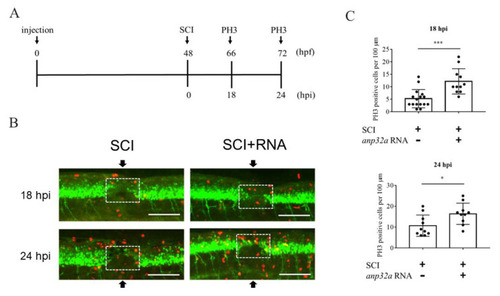
ANP32a is required for the neuronal regeneration of zebrafish larvae after SCI. (A) The experimental flowchart showing the time course of microinjection of either Anp32a mRNA or Anp32a morpholinos, SCI performance and observation of spinal cord regeneration. Embryos at the one-cell stage were injected with either wobble-Anp32a-flag mRNA or antisense morpholino oligonucleotides (MO) of Anp32a and SCI at 48 hpf, followed by analysis of the lesion gap at 0, 18 and 24 hpi. (B) Time course image of spinal cord regeneration in control embryos and Anp32a-overexpressed embryos at 0, 18 and 24 hpi. (C) Quantification of temporal regenerative response in SCI-control and wobble-Anp32a-flag mRNA-injected embryos at 18 hpi (left; control: n = 25; RNA + SCI: n = 19) and 24 hpi (right; control: n = 28; RNA + SCI: n = 16). (D) Time course image of spinal cord regeneration in control embryos and Anp32a-morphants at 0, 18 and 24 hpi. (E) Quantification of temporal regenerative response in SCI control embryos and Anp32a-morphants at 18 hpi (left; control: n = 31; MO + SCI: n = 30) and 24 hpi (right; control: n = 32; MO + SCI: n = 34). Scale bar: 100 μm; The Student’s t-test was used to perform statistical analysis (*, p < 0.05; p < 0.01; ***, p < 0.001; error bars indicate mean ± SD). |

Defective swimming activity was partially recovered in the SCI larvae with Anp32a overexpression. (A) Experimental flowchart showing the time course of microinjection of either Anp32a mRNA (RNA) or Anp32a morpholinos (MO), SCI performance and behavior test. Embryos at the one-cell stage were microinjected with either wobble-Anp32a-flag mRNA or Anp32a-MO. Following SCI at 48 hpf, we recorded the swimming trajectory route at 24 hpi. (B) To carry out gain-of-function and loss-of function studies, the swimming trajectory route of each fish from three groups was examined, including untreated control (neither injection nor SCI), SCI only (SCI), both wobble-Anp32a-flag mRNA injection and SCI (RNA + SCI), injection of Anp32a-MO and SCI (MO + SCI), and co-injected Anp32a-MO with wobble-Anp32a-flag mRNA injection and SCI (MO + RNA + SCI). (C) Quantification and statistical analysis. Swimming distances (cm) were calculated based on the recorded trajectory route shown in (B). The data in each group were averaged from all examined larvae (untreated control: n = 30; SCI: n = 66; RNA + SCI: n = 35; MO + SCI: n = 39; MO + RNA + SCI: n = 35). One-way ANOVA, followed by Tukey’s multiple comparison test, was used to perform statistical analysis (***, p < 0.001; error bars indicate mean ± SD). |
Overexpression of Anp32a could promote cell proliferation in SCI embryos during recovery. (A) The experimental flowchart. Anp32a mRNA was injected into embryos from zebrafish transgenic line Tg(mnx1:GFP) at the one-cell stage, followed by SCI at 48 hpf and staining with anti-PH3 at 18 and 24 hpi. (B) Proliferation patterns around the lesion site of embryos treated as indicated at 18 and 24 hpi were presented by immunofluorescence through antibody against phosphorylated histone H3 (PH3; Red) and visualized by laser confocal microscopy. Arrow indicates the SCI site, while white dotted box indicates the calculation area. (C) Statistical count of PH3-positive cells between SCI-Anp32a-overexpressed embryos (n = 11 at 18 hpi; n = 10 at 24 hpi) and SCI embryos without overexpression of Anp32a (n = 11 at 18 hpi; n = 10 at 24 hpi). A) Scale bar: 100 μm. The Student’s t-test was used to perform statistical analysis (*, p < 0.05; p < 0.01; ***, p < 0.001; error bars indicate mean ± SD). |

The overexpression of Anp32a in SCI embryos of zebrafish could induce an increase in the cell number of motor neuron progenitor cells (pMN) around the SCI site. Fluorescence-activated cell sorting (FACS) and a cell cycle analysis of pMN in Anp32a-overexpressing SCI embryos of zebrafish were performed. The Anp32a mRNA was microinjected into the one-cell stage of embryos from wild-type zebrafish, followed by SCI at 48 hpf. After deheading, suspended cells were stained with antibodies against Olig2 and DAPI at 24 hpi. (A) Scatter profiles of Anp32a-overexpressed SCI-zebrafish embryonic cells. All analytic cells were gated at P1; RFP-labelled Olig2-positive pMN cells were gated at P2; DAPI-labeled-positive cells were gated at P4; Olig2-negative cells were gated at P5. (B) Typical FACS dataset. The number shown in the right corner represents the percentage of cells at each gate relative to the total number of examined cells in each group. (C) Cell cycle analysis from DAPI-labeled-positive cells shown on P4. |

Overexpression of Anp32a in SCI embryos of zebrafish could induce the active proliferation of radial glial cells around the SCI site. Fluorescence-activated cell sorting (FACS) and a cell cycle analysis of radial glial cells in Anp32a-overexpressing SCI embryos of zebrafish were performed. Anp32a mRNA was microinjected into one-cell stage embryos from Tg(gfap:GFP) zebrafish, followed by SCI at 48 hpf and DAPI staining at 24 hpi. (A) Scatter profiles of Anp32a-overexpressing Tg(gfap:GFP) SCI-embryonic cells. All analytic cells were gated at P1; GFP-positive cells were gated at P2; DAPI-labeled-positive cells were gated at P6; GFP-negative cells were gated at P4. (B) Typical FACS dataset. The number shown in the right corner is the percentage of proliferated cells at each gate relative to the total examined cells in each group. (C) Cell cycle analysis from DAPI-labeled-positive cells shown on P6. |

Proliferation and cell number of radial glial cells and motor neurons were increased in the Anp32a-overexpression SCI embryos. The Anp32a mRNA was microinjected into the one-cell stage of embryos from zebrafish transgenic lines (A,B) Tg(gfap:GFP) and (C–F) the crossed strain of Tg(gfap:GFP) and Tg(mnx1:TagRFP), followed by BrdU injection, SCI at 48 hpf, and finally, staining with PH3 at 24 hpi. (A) Proliferation patterns at the lesion site of Tg(gfap:GFP) embryos treated as indicated at 24 hpi were displayed by immunofluorescence through reaction with antibodies against phosphorylated histone H3 (PH3; Red) and observation under laser confocal microscopy. (B) Statistical analysis showed a significantly increased number of PH3-positive cells in Anp32a-overexpressed SCI embryos (n = 10) compared to untreated embryos (n = 3) and SCI-control embryos (n = 14) at 24 hpi. One-way ANOVA followed by Tukey’s multiple comparison test was used to perform statistical analysis (*, p < 0.05; ** p < 0.01; error bars indicate mean ± SD). (C) Proliferation patterns at the lesion site of transgenic cross strain Tg(gfap:GFP) X Tg(mnx1:TagRFP) embryos treated as indicated at 24 hpi showing GFAP-positive cells (green) colocalized with BrdU-positive cells (purple) around the lesion area. (D) Statistical analysis of GFAP +/BrdU+ colocalized cells in SCI-control and Anp32a-overexpressing SCI embryos. (E) Proliferation patterns at the lesion site of Tg(gfap:GFP) X Tg(mnx1:TagRFP) embryos treated as indicated at 24 hpi showing red-labelled motor neurons colocalized with BrdU-positive cells (purple) around the lesion area. The specimens in Figure 8C, F originated from the same embryos. (F) Statistical analysis of motor neuron +/BrdU + colocalized cells in SCI-control and Anp32a-overexpression SCI embryos. Scale bar: 100 μm; (D,F) Student’s t-test was used to perform statistical analysis (* p < 0.05; ** p < 0.01; error bars indicate mean ± SD). |