
- Title
-
Utilizing a Population-Genetic Framework to Test for Gene-Environment Interactions between Zebrafish Behavior and Chemical Exposure
- Authors
- Thunga, P., Truong, L., Rericha, Y., Du, J., Morshead, M., Tanguay, R.L., Reif, D.M.
- Source
- Full text @ Toxics
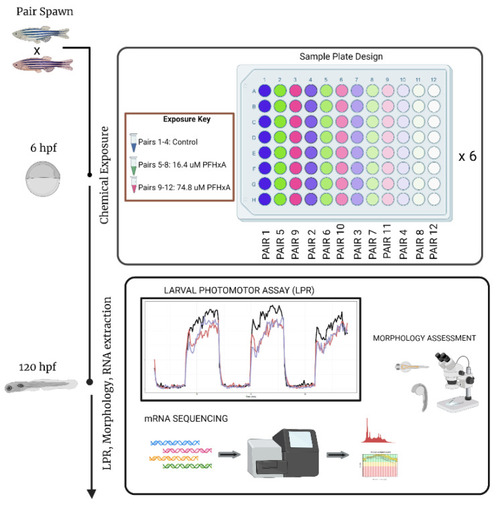
Experimental setup for direct embryonic exposure study (zebrafish embryos exposed to control, 16.4 μM or 74.8 μM of PFHxA from @ 6hpf; phenotypic measurements, i.e., behavioral assessments at 120hpf; developmental assessments of 13 specific morphology endpoints at 120 hpf) for a single test chemical. LPR–Larval Photomotor Response assay. (Figure created with |

( |
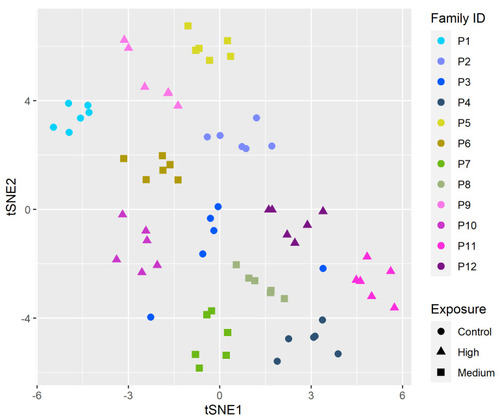
tSNE of normalized gene expression counts of genes that had a significant GxE effect. Color of the points represent family and shape represents exposure. Shades of blue are controls; shades of green represent medium PFHxA groups, and shades of pink represent high PFHxA groups. |