
Image
|
Figure Caption
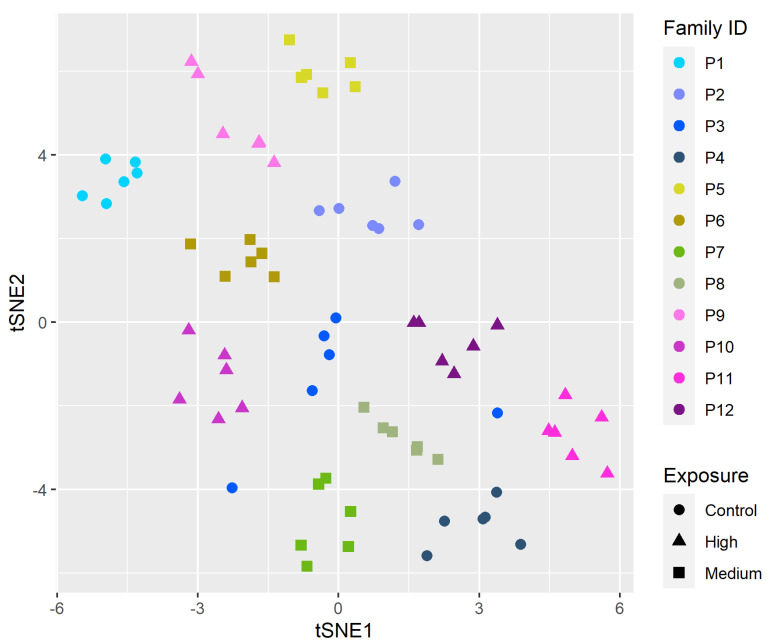
Figure 3
tSNE of normalized gene expression counts of genes that had a significant GxE effect. Color of the points represent family and shape represents exposure. Shades of blue are controls; shades of green represent medium PFHxA groups, and shades of pink represent high PFHxA groups.
Acknowledgments
This image is the copyrighted work of the attributed author or publisher, and
ZFIN has permission only to display this image to its users.
Additional permissions should be obtained from the applicable author or publisher of the image.
Full text @ Toxics