
- Title
-
Loss of glyoxalase 2 alters the glucose metabolism in zebrafish
- Authors
- Tabler, C.T., Lodd, E., Bennewitz, K., Middel, C.S., Erben, V., Ott, H., Poth, T., Fleming, T., Morgenstern, J., Hausser, I., Sticht, C., Poschet, G., Szendroedi, J., Nawroth, P.P., Kroll, J.
- Source
- Full text @ Redox Biol.
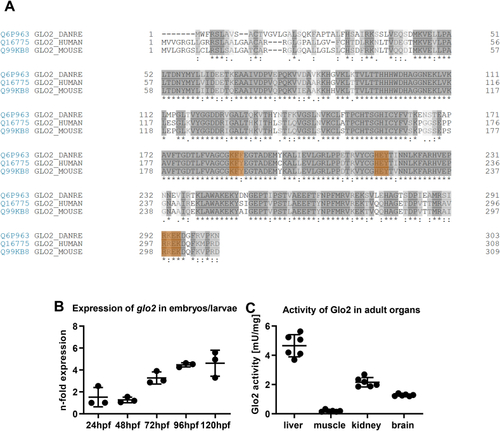
Alignment of the glo2 sequence across different species, expression patterns and organ specific activity of Glo2 in zebrafish. A) Alignment of the amino acid sequences of Glo2 in zebrafish (line 1), human (line 2) and mouse (line 3). The 3 domains making up the substrate binding site are highlighted in orange and show great similarities across species. Created with UniProt alignment tool (Access: 12/08/2021). B) Wildtype zebrafish embryos and larvae showed an increasing expression of glo2 mRNA over the first five days of development. Measured using RT-qPCR, compared to b2m. One datapoint represents one clutch of 50 larvae. N = 3. C) Adult wildtype zebrafish showed a very strong activity of Glo2 in the liver, followed by kidney and brain, with little relative activity in skeletal muscle. SD-Lactoylglutathione was used as substrate, activity was measured spectrophotometrically. N = 6. One datapoint represents organ-tissue from one single zebrafish. (For interpretation of the references to colour in this figure legend, the reader is referred to the Web version of this article.) |
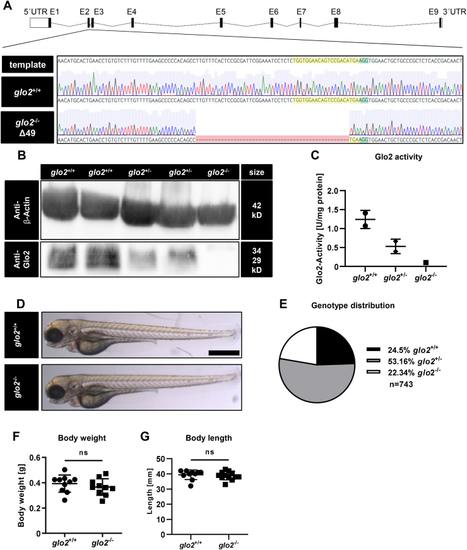
Generation and validation of glo2−/−zebrafish using CRISPR-Cas9. A) The target site (highlighted in yellow) and PAM site (highlighted in green) for CRISPR-Cas9 were selected in exon 2 of the glo2 gene. The gene-segment containing the target site was amplified with PCR and analyzed with Sanger sequencing. Subsequent genotyping was conducted using PCR, followed by electrophoresis of the PCR product in an agarose gel. Zebrafish with a 49 base pair deletion were selected for the generation of the glo2−/− line. B) The Western blot analysis using a Glo2-specific antibody showed a complete loss of Glo2 in adult glo2−/− zebrafish and a partial loss of Glo2 in glo2+/− zebrafish. Samples were derived from homogenized adult zebrafish tissue, β-Actin was used as loading control. Original images have been cropped. C) Glo2 activity measurements showed a 92 % loss of activity from glo2+/+ to glo2−/− samples and a 47 % loss from glo2+/+ to glo2+/− zebrafish. Tissue was derived from homogenized adult zebrafish. SD-Lactoylglutathione was used as substrate, activity was measured spectrophotometrically. One datapoint represents tissue from one zebrafish. N = 2/2/1. D) The gross morphology of glo2−/− larvae appeared unchanged at 96 hpf upon analysis with a light microscope. Scale bar = 500 μm. E) The distribution of genotypes in heterozygous matings showed the expected distribution and no significant loss of glo2−/− zebrafish, indicating normal survival. F) Adult glo2−/− zebrafish showed a normal body weight compared to glo2+/+ zebrafish. One datapoint represents one zebrafish. N = 10. G) Adult glo2−/− zebrafish showed a normal body length compared to glo2+/+ zebrafish. One datapoint represents one zebrafish. N = 10. For statistical analysis chi-square test, (E) and normality tests (F, G) were used, followed by unpaired t-test (F), or Mann-Whitney test (G). Data presented as mean ± SD. ns = p > 0.05, UTR: untranslated region, E: exon, WT: wildtype, kD: kilodalton. (For interpretation of the references to colour in this figure legend, the reader is referred to the Web version of this article.) |
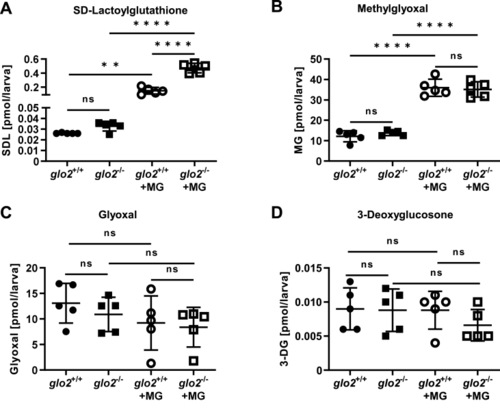
glo2−/−zebrafish showed an increase in SD-Lactoylglutathione after incubation in methylglyoxal. A) Incubation of the larvae in 500 μM MG caused a tenfold increase of SDL, with a more pronounced increase of SDL in glo2−/− larvae compared to glo2+/+ larvae, (B) but showed no increase in baseline MG. Incubation with 500 μM MG caused an equal increase of MG in glo2−/− and glo2+/+ larvae. C) The levels of glyoxal were unchanged in glo2−/− larvae and were uninfluenced by incubation in 500 μM MG. D) The levels of 3-deoxyglucosone were unchanged in glo2−/− larvae and were uninfluenced by incubation in 500 μM MG. Measurements were conducted using LC-MS/MS. One datapoint represents one clutch of 46 larvae, collected at 120 hpf. For statistical analysis normality tests were used for all samples, followed by unpaired t-test (A, B, C, D), or Mann-Whitney test (A, C, D). Data presented as mean ± SD. N = 5. ns = p > 0.05, ** = p < 0.01, **** = p < 0.0001. SDL: SD-Lactoylglutathione, MG: methylglyoxal, 3-DG: 3-deoxyglucosone, LC-MS: liquid chromatography/mass spectrometry. |
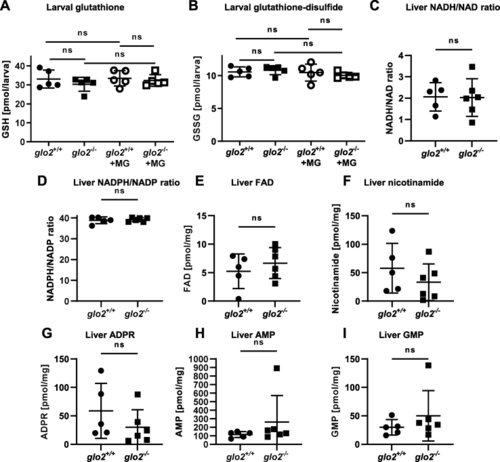
The redox status of larvae and the adult liver was unaffected by the loss of Glo2. A) The levels of glutathione remained unchanged in glo2−/− zebrafish under normal conditions as well as after incubation in 500 μM MG. Measurements were conducted using LC-MS/MS. One datapoint represents one clutch of 46 larvae, collected at 120 hpf. B) The levels of glutathione-disulfide remained unchanged in glo2−/− zebrafish under normal conditions as well as after incubation in 500 μM of MG. Measurements were conducted using LC-MS/MS. One datapoint represents one clutch of 46 larvae, collected at 120 hpf. C) NADH/NAD ratios and NADPH/NADP (D) ratios were normal in glo2−/− animal livers, indicating no increased redox stress. Liver FAD (E), nicotinamide (F), ADPR (G), AMP (H) and GMP (I) were unchanged in glo2−/− animals compared to glo2+/+ animals. Measured via GC-MS. One datapoint represents the liver of one adult zebrafish. N = 5. For statistical analysis normality tests were used for all samples, followed by unpaired t-test (A, B, C, D, E, F, G), or Mann-Whitney test (A, H, I). Data presented as mean ± SD. ns = p > 0.05. FAD: Flavin adenine dinucleotide, GSH: Glutathione, GSSG: Glutathione-disulfide, ADPR: adenosine diphosphate ribose, AMP: adenosine monophosphate, GMP: guanosine monophosphate, LC-MS: liquid chromatography/mass spectrometry, GC-MS: gas chromatography/mass spectrometry. |
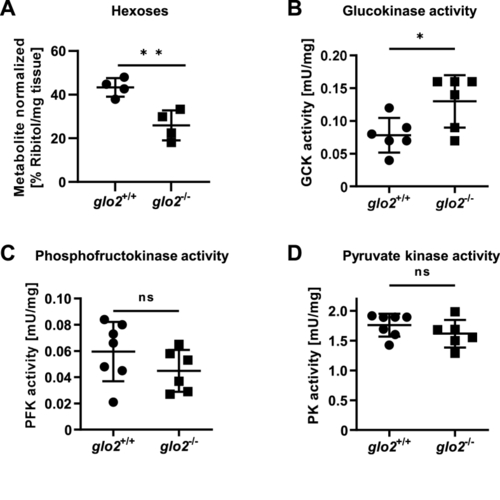
Adult glo2−/−liver showed a reduced concentration of hexoses. A) GC-MS revealed a reduced hexose content of the glo2−/− liver. N = 4. B) Glucokinase showed increased postprandial activity in glo2−/− liver tissue. N = 6. C) The activity of phosphofructokinase remained unaltered in the postprandial state in glo2−/− zebrafish. N = 6. D) The activity of pyruvate kinase remained unaltered in the postprandial state in glo2−/− zebrafish. N = 6. One datapoint represents the liver of one zebrafish. For statistical analysis normality tests were used for all samples, followed by unpaired t-test (A, C), or Mann-Whitney test (B, D). Data presented as mean ± SD. ns = p > 0.05, * = p < 0.05, ** = p < 0.01. GC-MS: gas chromatography/mass spectrometry, GCK: glucokinase, PFK: phosphofructokinase, PK: pyruvate kinase. |
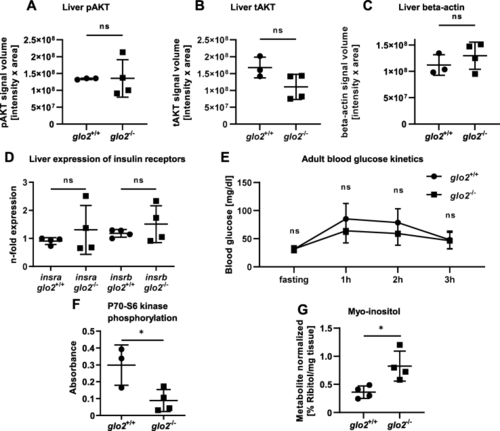
glo2−/−zebrafish showed a reduction of liver P70–S6 kinase activation while maintaining euglycemia and unchanged AKT phosphorylation.A) The quantification of the pAKT Western blot in glo2−/− livers showed no change in phosphorylation in the postprandial liver compared to the liver of wildtype zebrafish, indicating intact insulin signaling in glo2−/− livers. B) The total amount of AKT was unchanged in glo2−/− and glo2+/+ zebrafish liver. C) The quantification of the housekeeping gene β-actin showed no significant difference in signal volume, indicating equal loading in all samples. D) The expression of insulin receptor A/B mRNA remained unaltered in glo2−/− zebrafish. Measured using RT-qPCR, normalized to b2m. N = 4. E)glo2−/− and glo2+/+ zebrafish showed similar blood glucose kinetics from fasting to 3 h postprandial state. N = 3-5 adult zebrafish. F)glo2−/− zebrafish showed a reduction of the phosphorylation of P70–S6 kinase. N = 3/4. G) The relative amount of myo-inositol was increased in glo2−/− zebrafish. Determined through GC/MS. N = 4. One datapoint represents one zebrafish. N = 3/4. For statistical analysis normality tests were used (A, B, C, D, E, F, G), followed by unpaired t-tests (A, B, C, D, E, F, G). Data presented as mean ± SD. ns = p > 0.05, * = p < 0.05. insr: insulin receptor, pAKT: phosphorylated AKT, tAKT: total AKT, GC-MS: gas chromatography/mass spectrometry. |
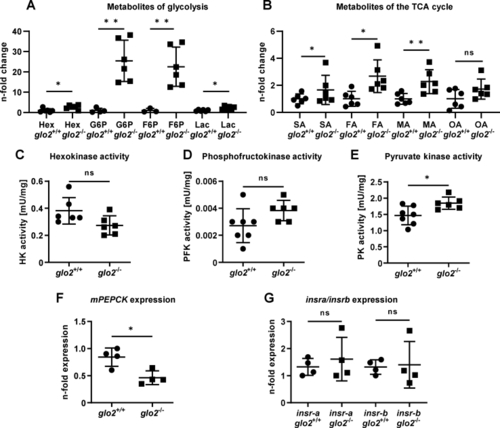
Adult glo2−/−skeletal muscle showed an increased concentration of hexoses and activity of glycolysis and TCA cycle. A) GC/MS analysis of the metabolome of glo2−/− skeletal muscle showed an increase in hexoses, G6P, F6P and lactate. N = 3–6. B) The GC/MS analysis of various metabolites of the TCA cycle also showed an increase. N = 6. C) Activity measurements of hexokinase were unchanged in glo2−/− zebrafish skeletal muscle. N = 6. D) Activity measurements of phosphofructokinase were unchanged in glo2−/− zebrafish. N = 6. E) Pyruvate kinase activity was increased, indicating increased glycolysis. N = 6. F)mPEPCK expression was reduced in glo2−/− zebrafish. Measured via RT-qPCR. N = 4. One datapoint represents skeletal muscle tissue from one zebrafish. G) Skeletal muscle insulin receptor expression was unchanged in glo2−/− animals. Measured via qPCR, normalized to b2m. N = 4. For statistical analysis normality tests were used for all samples, followed by unpaired t-test (A, B, C, D, E, F, G). Data presented as mean ± SD. ns = p > 0.05, * = p < 0.05, ** = p < 0.01. insra: insulin receptor A, insrb: insulin receptor B, Hex: hexoses, G6P: glucose-6-phosphate, F6P: fructose-6-phosphate, Lac: lactate, TCA cycle: tricarboxylic acid cycle, SA: succinic acid, FA: fumaric acid, MA: malic acid, OA: oxalic acid, HK: hexokinase, PFK: phosphofructokinase, PK: pyruvate kinase, mPEPCK: phosphoenolpyruvate carboxykinase 2 (mitochondrial). |
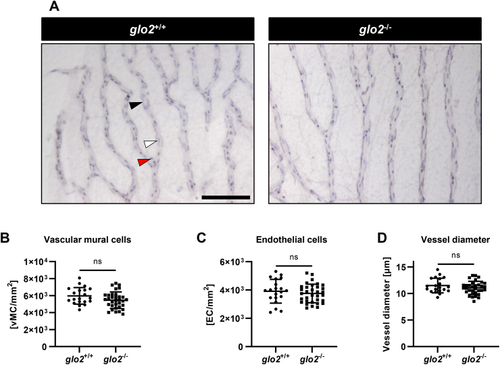
Adult retinae displayed normal cell distribution and vessel morphology. A) Light-microscopical analysis of retinal digests showed unchanged vasculature. Black arrow: vascular mural cell, white arrow: endothelial cell, red arrow: erythrocyte. Scale bar = 100 μm. B) Vascular mural cell count remained unchanged in glo2−/− retinae. C) Endothelial cell count remained equally unchanged in glo2−/− retinae. D) Vessel diameter also remained unchanged in glo2−/− retinae. One datapoint represents the measurements in one 100 μm grid square. N = 3/4. For statistical analysis normality tests were used for all samples, followed by unpaired t-test (B, C, D). Data presented as mean ± SD. ns = p > 0.05. vMC: vascular mural cells, EC: endothelial cells. (For interpretation of the references to colour in this figure legend, the reader is referred to the Web version of this article.) |
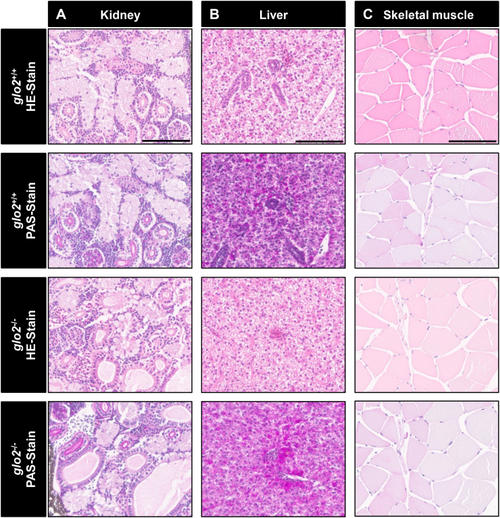
Histological analysis of adult liver, skeletal muscle and kidney HE stains and PAS reaction showed normal tissue morphology in glo2−/−zebrafish. A)The analysis of glomeruli, proximal tubules and distal tubules of the kidney did not reveal any significant structural changes.B) Analysis of the liver did not reveal any significant alterations of the liver parenchyma.C)The structure and appearance of skeletal muscle fibers remained unchanged in glo2−/− zebrafish. Scale bar = 100 μm for A, B, C. N = 6. |
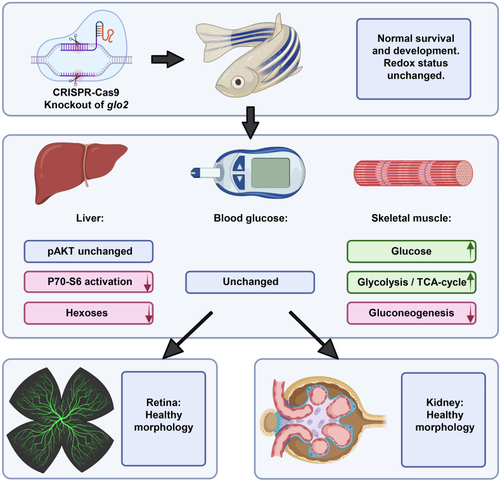
Loss of Glo2 leads to reduced P70–S6 kinase phosphorylation and hexose content in the liver. The knockout of glyoxalase 2 via CRISPR-Cas9 did not affect the redox status or impair the survival and general development of glo2−/− zebrafish. The liver, the organ with the highest glo2 expression, showed reduced P70–S6 kinase phosphorylation and reduced glucose concentrations, while AKT phosphorylation remained unaffected. Blood glucose remained normal. Skeletal muscle showed a strong increase of glucose concentrations, glycolysis and TCA cycle activity. Gluconeogenesis in contrast was downregulated. The retinal vasculature and kidneys did not show altered morphology and architecture. |