
|
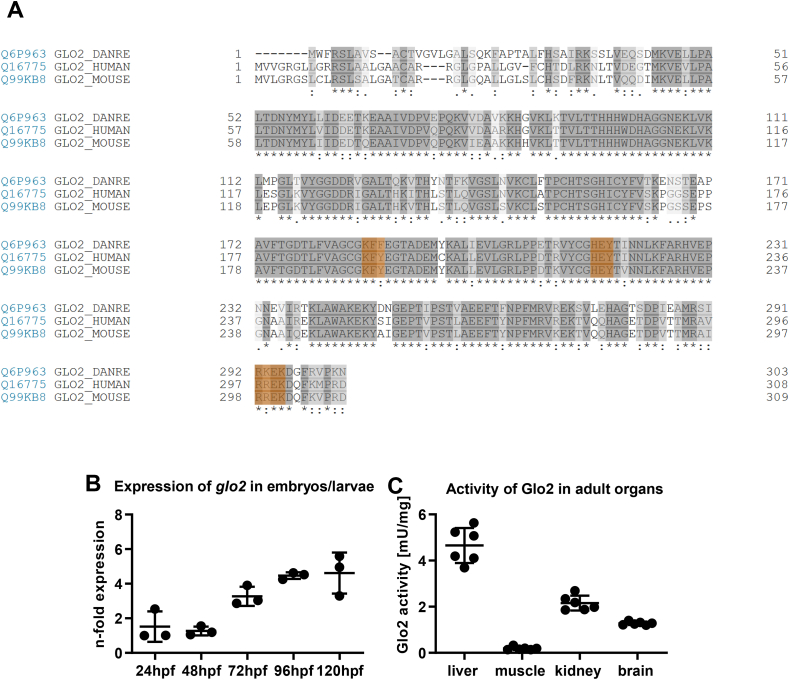
Fig. 1
Alignment of the glo2 sequence across different species, expression patterns and organ specific activity of Glo2 in zebrafish. A) Alignment of the amino acid sequences of Glo2 in zebrafish (line 1), human (line 2) and mouse (line 3). The 3 domains making up the substrate binding site are highlighted in orange and show great similarities across species. Created with UniProt alignment tool (Access: 12/08/2021). B) Wildtype zebrafish embryos and larvae showed an increasing expression of glo2 mRNA over the first five days of development. Measured using RT-qPCR, compared to b2m. One datapoint represents one clutch of 50 larvae. N = 3. C) Adult wildtype zebrafish showed a very strong activity of Glo2 in the liver, followed by kidney and brain, with little relative activity in skeletal muscle. SD-Lactoylglutathione was used as substrate, activity was measured spectrophotometrically. N = 6. One datapoint represents organ-tissue from one single zebrafish. (For interpretation of the references to colour in this figure legend, the reader is referred to the Web version of this article.)