
|
Fig. 7
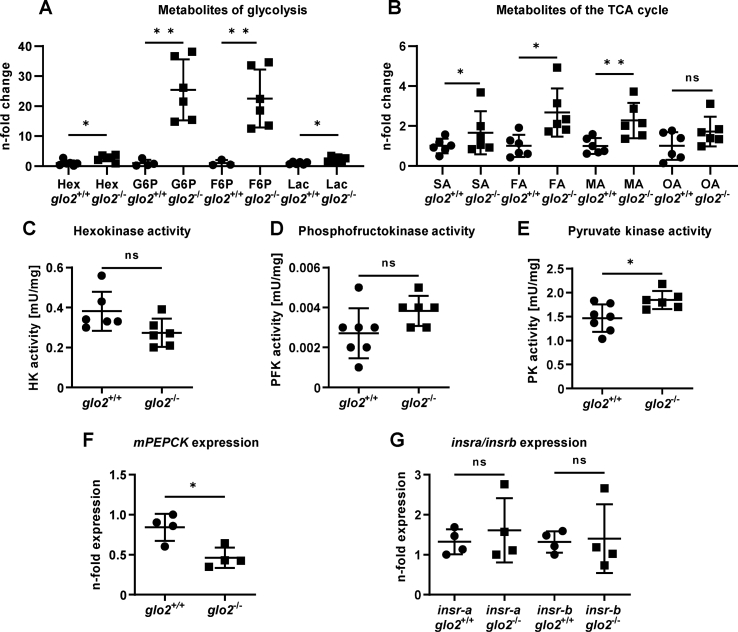
Adult glo2−/−skeletal muscle showed an increased concentration of hexoses and activity of glycolysis and TCA cycle. A) GC/MS analysis of the metabolome of glo2−/− skeletal muscle showed an increase in hexoses, G6P, F6P and lactate. N = 3–6. B) The GC/MS analysis of various metabolites of the TCA cycle also showed an increase. N = 6. C) Activity measurements of hexokinase were unchanged in glo2−/− zebrafish skeletal muscle. N = 6. D) Activity measurements of phosphofructokinase were unchanged in glo2−/− zebrafish. N = 6. E) Pyruvate kinase activity was increased, indicating increased glycolysis. N = 6. F)mPEPCK expression was reduced in glo2−/− zebrafish. Measured via RT-qPCR. N = 4. One datapoint represents skeletal muscle tissue from one zebrafish. G) Skeletal muscle insulin receptor expression was unchanged in glo2−/− animals. Measured via qPCR, normalized to b2m. N = 4. For statistical analysis normality tests were used for all samples, followed by unpaired t-test (A, B, C, D, E, F, G). Data presented as mean ± SD. ns = p > 0.05, * = p < 0.05, ** = p < 0.01. insra: insulin receptor A, insrb: insulin receptor B, Hex: hexoses, G6P: glucose-6-phosphate, F6P: fructose-6-phosphate, Lac: lactate, TCA cycle: tricarboxylic acid cycle, SA: succinic acid, FA: fumaric acid, MA: malic acid, OA: oxalic acid, HK: hexokinase, PFK: phosphofructokinase, PK: pyruvate kinase, mPEPCK: phosphoenolpyruvate carboxykinase 2 (mitochondrial).