
- Title
-
Proper modulation of AHR signaling is necessary for establishing neural connectivity and oligodendrocyte precursor cell development in the embryonic zebrafish brain
- Authors
- Martin, N.R., Patel, R., Kossack, M.E., Tian, L., Camarillo, M.A., Cintrón-Rivera, L.G., Gawdzik, J.C., Yue, M.S., Nwagugo, F.O., Elemans, L.M.H., Plavicki, J.S.
- Source
- Full text @ Front. Mol. Neurosci.

Developmental TCDD exposure impairs embryonic brain morphogenesis. PHENOTYPE:
|
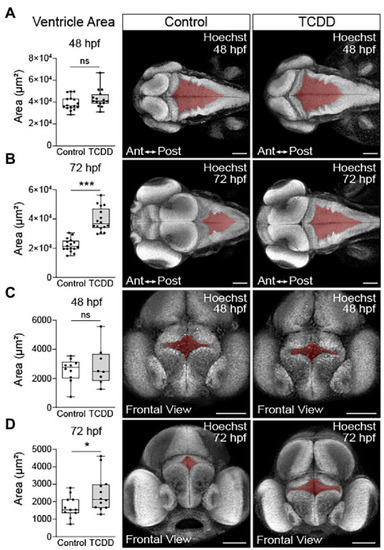
TCDD exposure increases brain ventricle size. To determine the impact of TCDD exposure on ventricular development, the hindbrain PHENOTYPE:
|

Embryonic TCDD exposure disrupts neural network formation. Dorsal confocal images of axon tracts in control |
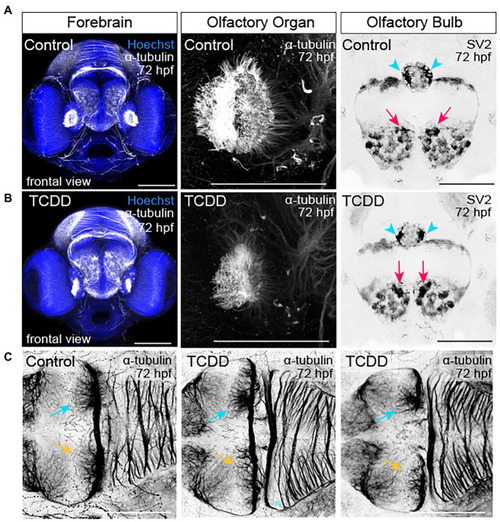
TCDD exposure disrupts development of the olfactory organs, olfactory bulbs, and habenular nuclei. |
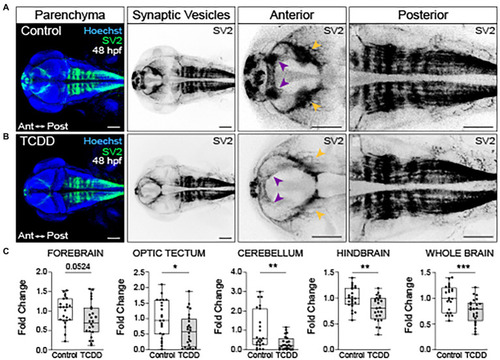
Embryonic TCDD exposure reduces synaptic vesicle 2 immunoreactivity. Dorsal confocal images of control (A) and TCDD-exposed (B) zebrafish at 48 hpf. The brain parenchyma was stained with Hoechst (DNA, blue) and immunolabeled with an antibody marking synaptic vesicle glycoprotein 2 (SV2) (green and inverted black). Forebrain vesicle production was decreased following TCDD exposure with notable reductions in the habenula (purple arrowheads). SV2 immunoreactivity was significantly reduced in the optic tectum (yellow arrowheads), cerebellum and hindbrain, and whole brain following TCDD exposure. (C) Fold change of SV2 immunolabeling in the forebrain, optic tectum, cerebellum, hindbrain, and whole brain was calculated relative to mean SV2 area coverage of controls. Statistical significance was determined by Welch’s t-test, *p < 0.05, **p < 0.01, ***p < 0.001. n = 23–24 fish/group across 3 replicates. Scale bar = 100 μm. Anterior (Ant) is left in all confocal micrographs. |

Embryonic TCDD exposure reduces oligodendrocyte numbers in the developing hindbrain. (A) Timeline of oligodendrocyte percursor cell (OPC) development and dorsal confocal images of the hindbrain at 48 hpf from transgenic zebrafish carrying fluorescent reporter genes for olig2 and sox10 [Tg(olig2:EGFP; sox10:RFP)]. Expression of olig2 marks oligodendrocyte precursors, oligodendrocytes, and motor neurons. Differentiated oligodendrocytes express sox10, which also marks migrating neural crest cells and other neural crest derived lineages. olig2+ cells were quantified along the midline, laterally and in total for the developing hindbrain of control (B) and TCDD-exposed (C) embryos. (D,E) Co-expression of olig2 driven EGFP and sox10 driven RFP was used to identify and quantify differentiated oligodendrocytes in the hindbrain. Cells were quantified along the midline, where OPCs are located, and in lateral domains containing OPC derived motor neurons and differentiated oligodendrocytes. Statistical significance was determined by Welch’s t-test. *p < 0.05, **p < 0.01. n = 18–20 fish/group across 3 replicates. Anterior (Ant) is left in all confocal micrographs. Scale bar = 100 μm. Magnification = 20x. |
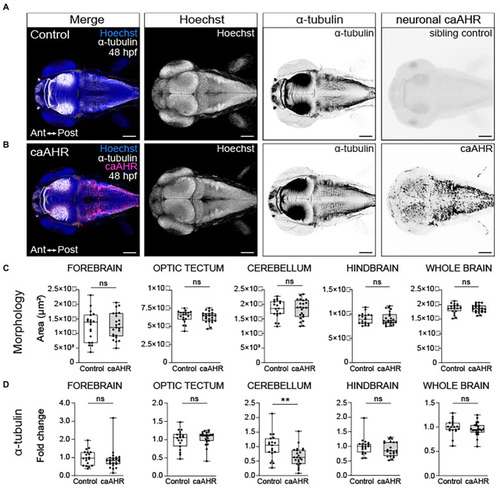
Neuron-specific activation of AHR disrupts the development of the cerebellum without affecting brain regions disrupted by global AHR activation. Confocal images at 48- hpf of control embryos (A) and embryos with neuron-specific expression of a constitutively active AHR [Tg(elav3l:Gal4;UAS:caAHR:2A-tRFP)] (B). Embryos were stained with Hoechst (blue in the first panel and white in second panel of both A,B) to visualize the brain parenchyma and immunolabeled with an anti-acetylated alpha tubulin antibody (α-tubulin) to mark axon tracts (white in the first panel and inverted black in the third panel of both A,B). There were no differences in the morphology of the forebrain, optic tectum, cerebellum, hindbrain, and whole brain at 48 hpf when comparing control (C) embryos to embryos with neuron-specific expression of a constitutively active AHR. (D) Fold change in acetylated α-tubulin expression in the forebrain, optic tectum, cerebellum, hindbrain, and whole brain in control and Tg(elav3l:Gal4;UAS:caAHR:2A-tRFP embryos relative to mean area coverage of α-tubulin in wild-type embryos. Statistical significance determined by Welch’s t-test, *p < 0.05, **p < 0.01, ***p < 0.001. n = 19–23 fish/group across 3 replicates. Anterior (Ant) is left in all confocal micrographs. Scale bar = 100 μm. Magnification = 10x. |
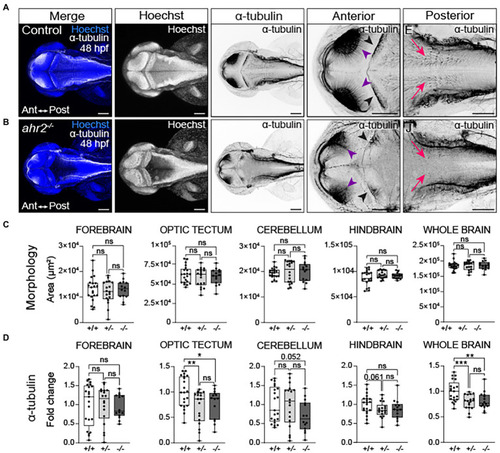
Loss of ahr2 disrupts neural network formation without affecting brain size. Dorsal views of control (A) and homozygous ahr2 mutant embryos (B) at 48 hpf stained with Hoechst (DNA, blue) to visualize the parenchyma and immunolabeled with an anti-acetylated α-tubulin antibody to mark axon tracts (white and inverted to black). (C) Area measurements of the forebrain, optic tectum, cerebellum, hindbrain, and whole brain at 48 hpf in wild-type ahr2, heterozygous ahr2, and homozygous ahr2 mutant embryos. (D) Fold change of acetylated α-tubulin in the forebrain, optic tectum, cerebellum, hindbrain, and whole brain of heterozygous ahr2, and homozygous ahr2 mutant embryos zebrafish relative to the mean acetylated α-tubulin area coverage of wild-type embryos. There were no apparent differences in the size of the forebrain, optic tectum, cerebellum, hindbrain, and whole brain in mutants when compared to controls (C); however, acetylated α-tubulin coverage was significantly reduced in the optic tectum (purple arrowheads) and the whole brain of homozygous and heterozygous ahr2 mutant embryos embryos relative to controls (D). Acetylated α-tubulin coverage in the cerebellum (black arrowheads) and hindbrain (pink arrowheads) was also reduced, but this was not a statistically significant finding with the analysis pipeline used for quantification (D). Statistical significance determined by Welch’s t-test, *p < 0.05, **p < 0.01, ***p < 0.001. n = 14–21 fish/group across 3 replicates. Anterior is left in all confocal micrographs. Scale bar = 100 μm. Magnification = 10x with varying zoom. |