IMAGE

Figure 3

ID
ZDB-IMAGE-221218-16
Source
Figures for Martin et al., 2022
Image
Figure Caption

Figure 3

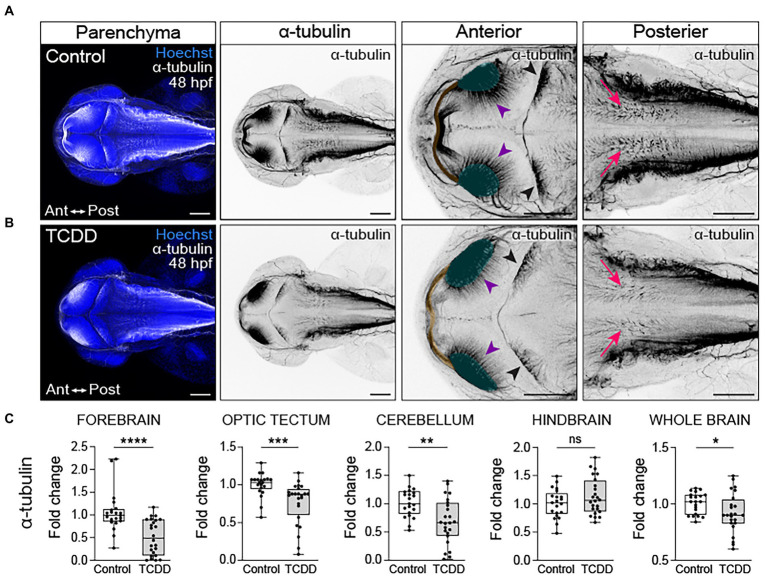
Embryonic TCDD exposure disrupts neural network formation. Dorsal confocal images of axon tracts in control (A) and TCDD-exposed (B) embryos at 48 hpf. The brain parenchyma is marked by Hoechst staining (DNA, blue) and axon tracts are immunolabeled with an anti-acetylated α tubulin (α-tubulin) antibody (white and inverted black signal). Projections emanating from the optic neuropils (green shading and purple arrowheads) were reduced in TCDD-exposed embryos. The posterior commissure (yellow shading) appears defasciculated following TCDD exposure. Purkinje cells in the cerebellum (black arrowheads) were malformed in TCDD-exposed zebrafish relative to controls. Although the area covered by acetylated α-tubulin in the hindbrain was not statistically different between groups, we noted that the acetylated α-tubulin projections in the hindbrain (pink arrows) appear diminished in TCDD-exposed embryos. (C) Fold change of acetylated α-tubulin in the forebrain, optic tectum, cerebellum, hindbrain, and whole brain calculated relative to average α-tubulin area coverage in controls. Statistical significance determined by Welch’s t-test, *p < 0.05, **p < 0.01, ***p < 0.001, ****p < 0.0001. n = 21–26 fish/group across 3 replicates. Anterior (Ant) is left in all confocal micrographs. First 2 panels containing confocal micrographs in A and B are at a 10x magnification. All other confocal micrographs are at a 10x magnification with a 2.5 digital zoom). Scale bar = 100 μm.

Acknowledgments
This image is the copyrighted work of the attributed author or publisher, and ZFIN has permission only to display this image to its users. Additional permissions should be obtained from the applicable author or publisher of the image. Full text @ Front. Mol. Neurosci.