
- Title
-
High-content drug screening in zebrafish xenografts reveals high efficacy of dual MCL-1/BCL-XL inhibition against Ewing sarcoma
- Authors
- Grissenberger, S., Sturtzel, C., Wenninger-Weinzierl, A., Radic-Sarikas, B., Scheuringer, E., Bierbaumer, L., Etienne, V., Némati, F., Pascoal, S., Tötzl, M., Tomazou, E., Metzelder, M., Putz, E.M., Decaudin, D., Delattre, O., Surdez, D., Kovar, H., Halbritter, F., Distel, M.
- Source
- Full text @ Cancer Lett.

Fig. 1. shSK-E17T Ewing sarcoma zebrafish xenografts A) Zebrafish xenografted with GFP-expressing shSK-E17T Ewing sarcoma cells (green) imaged on a fluorescence microscope over consecutive days from 2 hpi to 3 dpi. B) Immunostaining for human Ki67 revealing proliferating tumor cells and C) for cleaved Caspase 3 demarcating apoptotic cells at different time points from 2 hpi to 3 dpi. (B, n: 2 hpi = 5, 1 dpi = 7, 2 dpi = 5, 3 dpi = 6); (C, n: 2 hpi = 6, 1 dpi = 8, 2 dpi = 5, 3 dpi = 7). Scale bars are 250 μm in A and 50 μm in B and C. |
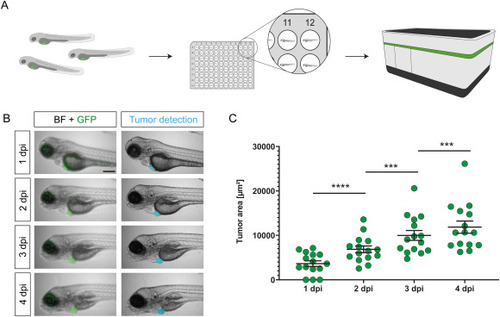
Fig. 2. Automated imaging and tumor size quantification of xenotransplanted zebrafish larvae A) Schematic representation of the imaging workflow: Xenotransplanted larvae were anesthetized, embedded in 96-well ZF plates (1 larva/well) and imaged in brightfield (BF) and fluorescence on the Operetta high-content imager (PerkinElmer). B) Representative images of shSK-E17T zebrafish xenografts imaged on consecutive days (1 dpi - 4 dpi), automated tumor detection and tumor area quantification. C) Measured tumor size areas from 1 dpi to 4 dpi (n = 15). Scale bar in B is 250 μm. Statistical analysis in C was performed with a repeated measure (RM) one-way ANOVA, ****: p ≤ 0.0001, ***: p ≤ 0.001. Error bars represent SEM of 15 individual larvae. |
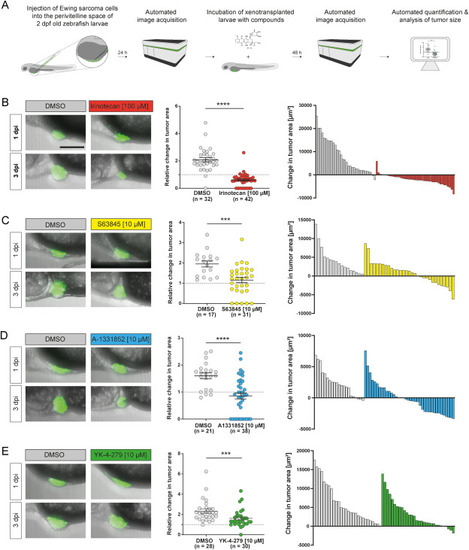
Fig. 3. Single agent treatment of xenotransplanted larvae A) Schematic representation of the workflow - Zebrafish embryos were xenotransplanted with shSK-E17T Ewing sarcoma cells at 2 dpf. After 24 h (1 dpi) embryos were imaged on the Operetta CLS and subsequently incubated in respective amounts of small compounds. After 48 h (3 dpi) larvae were imaged again and changes in tumor size were analyzed. B-E) Xenotransplanted larvae were treated with irinotecan (100 μM, B), S63845 (10 μM, C), A-1331852 (10 μM, D) and YK-4-279 (10 μM, E) for 48 h (1 dpi - 3 dpi). Dot plots show relative changes of tumor area (3 dpi/1 dpi). Waterfall plots (right panels, 1 bar per zebrafish) total change in tumor area (3 dpi - 1 dpi). Scale bar is 125 μm. Statistical analyses were performed with a Mann-Whitney test, ****: p ≤ 0.0001, ***: p ≤ 0.001. Error bars represent SEM of combined larvae from two independent experiments. |
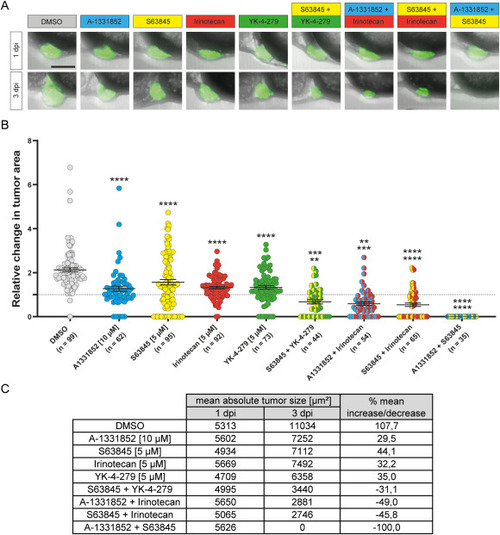
Fig. 4. Combination treatments of xenotransplanted larvae Xenotransplanted larvae were treated with A-1331852 (10 μM), S63845 (5 μM), irinotecan (5 μM), YK-4-279 (5 μM) and respective combinations for 48 h (1 dpi - 3 dpi). A) Representative images for average change in tumor size for every condition. B) Relative change of tumor area (3 dpi/1 dpi). C) Mean absolute tumor sizes and percent changes. Scale bar is 125 μm. For evaluation, single treatments were compared to DMSO control and combination treatments were compared to respective single treatments (top significance value indicates comparison to first compound, bottom value indicates comparison to second compound). Statistical analyses were performed with a Kruskal-Wallis test, ****: p ≤ 0.0001, ***: p ≤ 0.001, **: p ≤ 0.01. Error bars represent SEM of combined larvae from two independent experiments. |
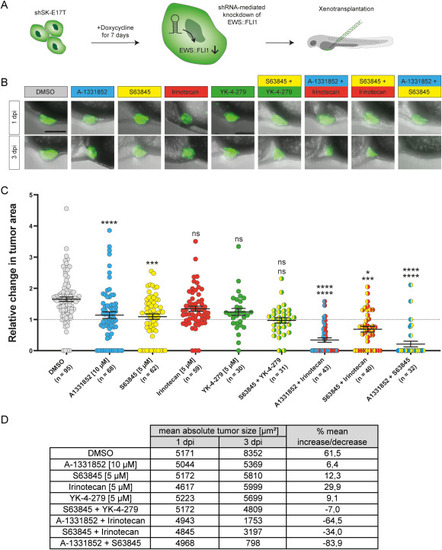
Fig. 5. Combination treatments of xenotransplanted larvae in EWS:FLI1low conditions A) Schematic representation of the workflow: shSK-E17T cells were pre-treated with doxycycline for 7 days in culture to induce knockdown of EWS:FLI1. Xenotransplanted embryos were incubated in E3 with doxycycline over the course of the experiment. Embryos were treated with A-1331852 (10 μM), S63845 (5 μM), irinotecan (5 μM), YK-4-279 (5 μM) and respective combinations for 48 h (1 dpi - 3 dpi). B) Representative images for average change in tumor size for every condition. C) Relative change of tumor area (3 dpi/1 dpi). D) Mean absolute tumor sizes and percent changes. Scale bar is 125 μm. For evaluation, single treatments were compared to DMSO control and combination treatments were compared to respective single treatments (top significance value indicates comparison to first compound, bottom value indicates comparison to second compound). Statistical analyses were performed with a Kruskal-Wallis test, ****: p ≤ 0.0001, ***: p ≤ 0.001, *: p ≤ 0.05. Error bars represent SEM of combined larvae of two independent experiments. |
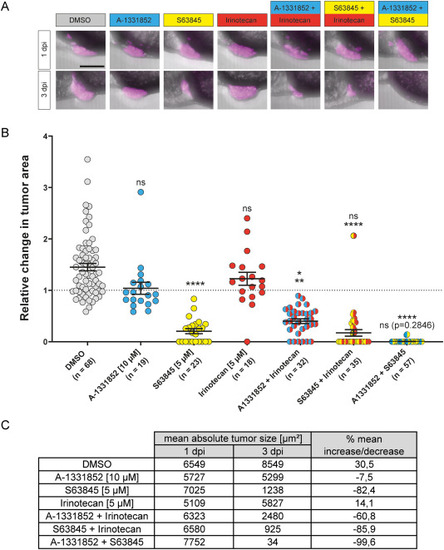
Fig. 6. Combination treatments in xenografts with patient-derived cells (IC-pPDX-87) Xenotransplanted larvae were treated with A-1331852 (10 μM), S63845 (5 μM), irinotecan (5 μM), and respective combinations for 48 h (1 dpi - 3 dpi). A) Representative images for average change in tumor size for every condition. B) Relative change in tumor area (3 dpi/1 dpi). C) Mean absolute tumor sizes and percent changes. Scale bar is 125 μm. Significance is shown as followed: Single treatments were compared to DMSO control. Combination treatments were compared to respective single treatments (top value indicates comparison to first compound, bottom value indicates comparison to second compound). Statistical analyses were performed with a Kruskal-Wallis test, ****: p ≤ 0.0001, **: p ≤ 0.01, *: p ≤ 0.05. Error bars represent SEM of combined larvae (n) of one experiment (single treatments) or two experiments (combinations). |
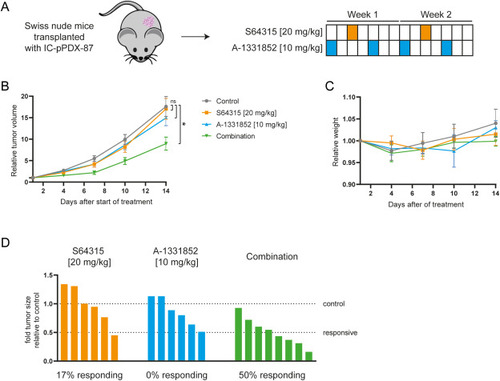
Fig. 7. Mouse PDX experiments A) Female Swiss nude mice were transplanted with IC-pPDX-87 tumor fragments and treated with either A-1331852 (10 mg/kg twice per week), or S64315 (20 mg/kg once a week) or the respective combination for 14 days. B) Tumor sizes were measured twice a week and relative tumor volumes were calculated. C) Mice were weighed twice per week and relative weight was calculated. D) x-fold tumor size change compared to control group 14 days after the initiation of treatment was calculated. A tumor was considered to be responsive to therapy, when the x-fold change of tumor size was below 0.5. This was the case for 17% (1/6 mice) treated with S64315, 0% (0/6 mice) treated with A-1331852 and 50% (4/8 mice) treated with the combination. Statistical analyses were performed with a Kruskal-Wallis test, *: p ≤ 0.05. Error bars represent SEM of combined mice (6–8 per group). |