
|
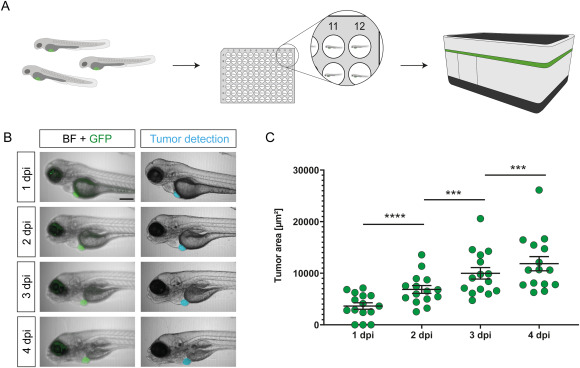
Fig. 2 Fig. 2. Automated imaging and tumor size quantification of xenotransplanted zebrafish larvae A) Schematic representation of the imaging workflow: Xenotransplanted larvae were anesthetized, embedded in 96-well ZF plates (1 larva/well) and imaged in brightfield (BF) and fluorescence on the Operetta high-content imager (PerkinElmer). B) Representative images of shSK-E17T zebrafish xenografts imaged on consecutive days (1 dpi - 4 dpi), automated tumor detection and tumor area quantification. C) Measured tumor size areas from 1 dpi to 4 dpi (n = 15). Scale bar in B is 250 μm. Statistical analysis in C was performed with a repeated measure (RM) one-way ANOVA, ****: p ≤ 0.0001, ***: p ≤ 0.001. Error bars represent SEM of 15 individual larvae.