
- Title
-
Parental mutations influence wild-type offspring via transcriptional adaptation
- Authors
- Jiang, Z., El-Brolosy, M.A., Serobyan, V., Welker, J.M., Retzer, N., Dooley, C.M., Jakutis, G., Juan, T., Fukuda, N., Maischein, H.M., Balciunas, D., Stainier, D.Y.R.
- Source
- Full text @ Sci Adv
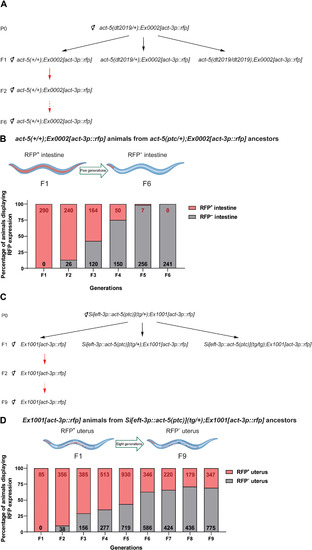
(A) Genetic crosses used to obtain Ex0002[act-3p::rfp] wild-type offspring from act-5(dt2019);Ex0002[act-3p::rfp] heterozygous nematodes. Black arrows indicate the self-fertilization of hermaphrodites; red arrows indicate subsequent wild-type self-crosses. (B) Percentage of adult Ex0002[act-3p::rfp] wild-type nematodes displaying ectopic red fluorescent protein (RFP) expression in their intestine through six generations from act-5(dt2019/+);Ex0002[act-3p::rfp] ancestors. Red numbers indicate the total number of Ex0002[act-3p::rfp] wild-type nematodes displaying ectopic RFP expression in their intestine in each generation; black numbers indicate the total number of Ex0002[act-3p::rfp] wild-type nematodes displaying pharynx-only RFP expression in each generation. (C) Genetic crosses used to obtain Ex1001[act-3p::rfp] offspring from Si[eft-3p::act-5(ptc)](tg/+);Ex1001[act-3p::rfp] nematodes. Black arrows indicate the self-fertilization of hermaphrodites; red arrows indicate subsequent wild-type self-crosses. (D) Percentage of adult Ex1001[act-3p::rfp] wild-type nematodes displaying ectopic RFP expression in their uterus through nine generations from Si[eft-3p::act-5(ptc)](tg/+);Ex1001[act-3p::rfp] ancestors. Red numbers indicate the total number of Ex1001[act-3p::rfp] wild-type nematodes displaying ectopic RFP expression in their uterus in each generation; black numbers indicate the total number of Ex1001[act-3p::rfp] wild-type nematodes displaying only pharynx and spermatheca RFP expression (fig. S1D) in each generation. Illustrations were created with BioRender.com. |

(A) Genetic crosses used to obtain wild-type (WT) embryos from TA-displaying heterozygous zebrafish and from subsequent incrosses. Black arrows indicate heterozygous intercrosses (intx); red arrow indicates subsequent wild-type incrosses (inx). (B) Relative mRNA levels of alcama and alcamb in 28 hpf wild-type embryos from AB incrosses and from alcamaptc/+ intercrosses. (C) Relative mRNA levels of vcla and vclb in 24 hpf wild-type embryos from AB incrosses and vclaptc/+ intercrosses. (D) Relative mRNA levels of egfl7 and emilin2a in 24 hpf wild-type embryos from AB incrosses and egfl7ptc/+ intercrosses. (E) Relative mRNA levels of egfl7 and emilin3a in 24 hpf wild-type embryos from AB incrosses and egfl7ptc/+ intercrosses. (F) Relative mRNA levels of alcama and alcamb in 28 hpf wild-type embryos obtained from AB incrosses and F1 alcama+/+ (i.e., wild types from alcamaptc/+ intercrosses) incrosses. (G) Relative mRNA levels of vcla and vclb in 24 hpf wild-type embryos obtained from AB incrosses and F1 vcla+/+ (i.e., wild types from vclaptc/+ intercrosses) incrosses. (H) Relative mRNA levels of egfl7 and emilin2a in 24 hpf wild-type embryos obtained from AB incrosses and F1 egfl7+/+ (i.e., wild types from egfl7ptc/+ intercrosses) incrosses. (I) Relative mRNA levels of egfl7 and emilin3a in 24 hpf wild-type embryos obtained from AB incrosses and F1 egfl7+/+ (i.e., wild types from egfl7ptc/+ intercrosses) incrosses. n = 3 biologically independent samples. Control expression levels were set at 1. Data are means ± SD, and a two-tailed Student’s t test was used to calculate P values. Ct values are listed in table S1. |
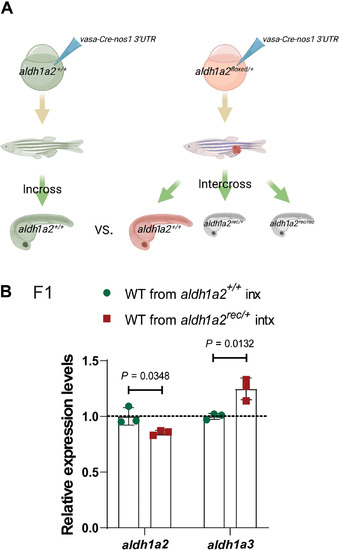
(A) Schematic representation of experimental setup and genetic crosses used to obtain wild-type offspring; red cell indicates a germline-specific mutation. (B) Relative mRNA levels of aldh1a2 and aldh1a3 in 24 hpf wild-type embryos from aldh1a2+/+ incrosses (inx) and aldh1a2rec/+ intercrosses (intx). Control expression levels were set at 1. n = 3 biologically independent samples. Data are means ± SD, and a two-tailed Student’s t test was used to calculate P values. Ct values are listed in table S1. (A) was created with BioRender.com. |
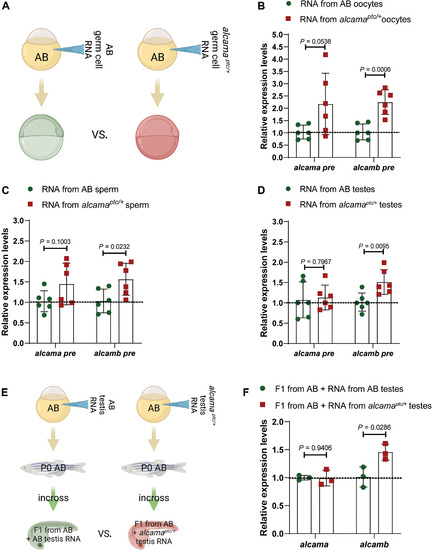
(A) Schematic representation of the experimental setup. (B) Relative pre-mRNA levels of alcama and alcamb in 6 hpf AB embryos injected with total RNA isolated from oocytes of wild types and alcamaptc/+ zebrafish. (C) Relative pre-mRNA levels of alcama and alcamb in 6 hpf AB embryos injected with total RNA isolated from sperm of wild types and alcamaptc/+ zebrafish. (D) Relative pre-mRNA levels of alcama and alcamb in 6 hpf AB embryos injected with total RNA isolated from testes of wild types and alcamaptc/+ zebrafish. (E) Schematic representation of the experimental setup. (F) Relative mRNA levels of alcama and alcamb in 28 hpf F1 offspring from AB zebrafish injected at the one-cell stage with total RNA isolated from testes of wild types and alcamaptc/+ zebrafish. n ≥ 3 biologically independent samples. Control expression levels were set at 1. Data are means ± SD, and a two-tailed Student’s t test was used to calculate P values. Ct values are listed in table S1. (A) and (E) were created with BioRender.com. |
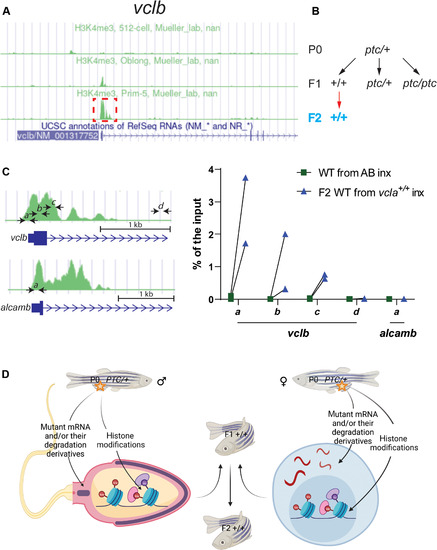
(A) Peaks of H3K4me3 ChIP-seq at the vclb locus at different stages (obtained from DANIO-CODE). Red boxed area was enlarged in (C) to show the relative location of the ChIP–qPCR primers marked by black arrows (also at the alcamb locus, which is used as an external/specificity control). (B) Genetic crosses were used to obtain F2 wild-type offspring from heterozygous zebrafish. Black arrows indicate heterozygous intercrosses (intx); red arrow indicates subsequent wild-type incrosses (inx). (C) ChIP-qPCR analysis of H3K4me3 occupancy near exon 1 of vclb in 512 cell stage wild-type embryos from incrosses of F1 vcla+/+ (i.e., wild types from vclaptc/+ intercrosses) compared with wild-type embryos from AB incrosses. Green peaks in vclb and alcamb loci represent prim-5 stage (24 hpf) H3K4me3 ChIP-seq data obtained from DANIO-CODE. Scale bars, 1 kb. n = 2 biologically independent samples. Ct values are listed in table S1. (D) Proposed model of intergenerational and transgenerational inheritance of TA (IGTA and TGTA). Mutant mRNAs, their degradation products (or their derivatives), and/or histone modifications are transmitted through the germline, leading to TA in the offspring. Additional mechanisms are likely to be involved in IGTA and TGTA. PTC, premature termination codon. (D) was created with BioRender.com. |