
|
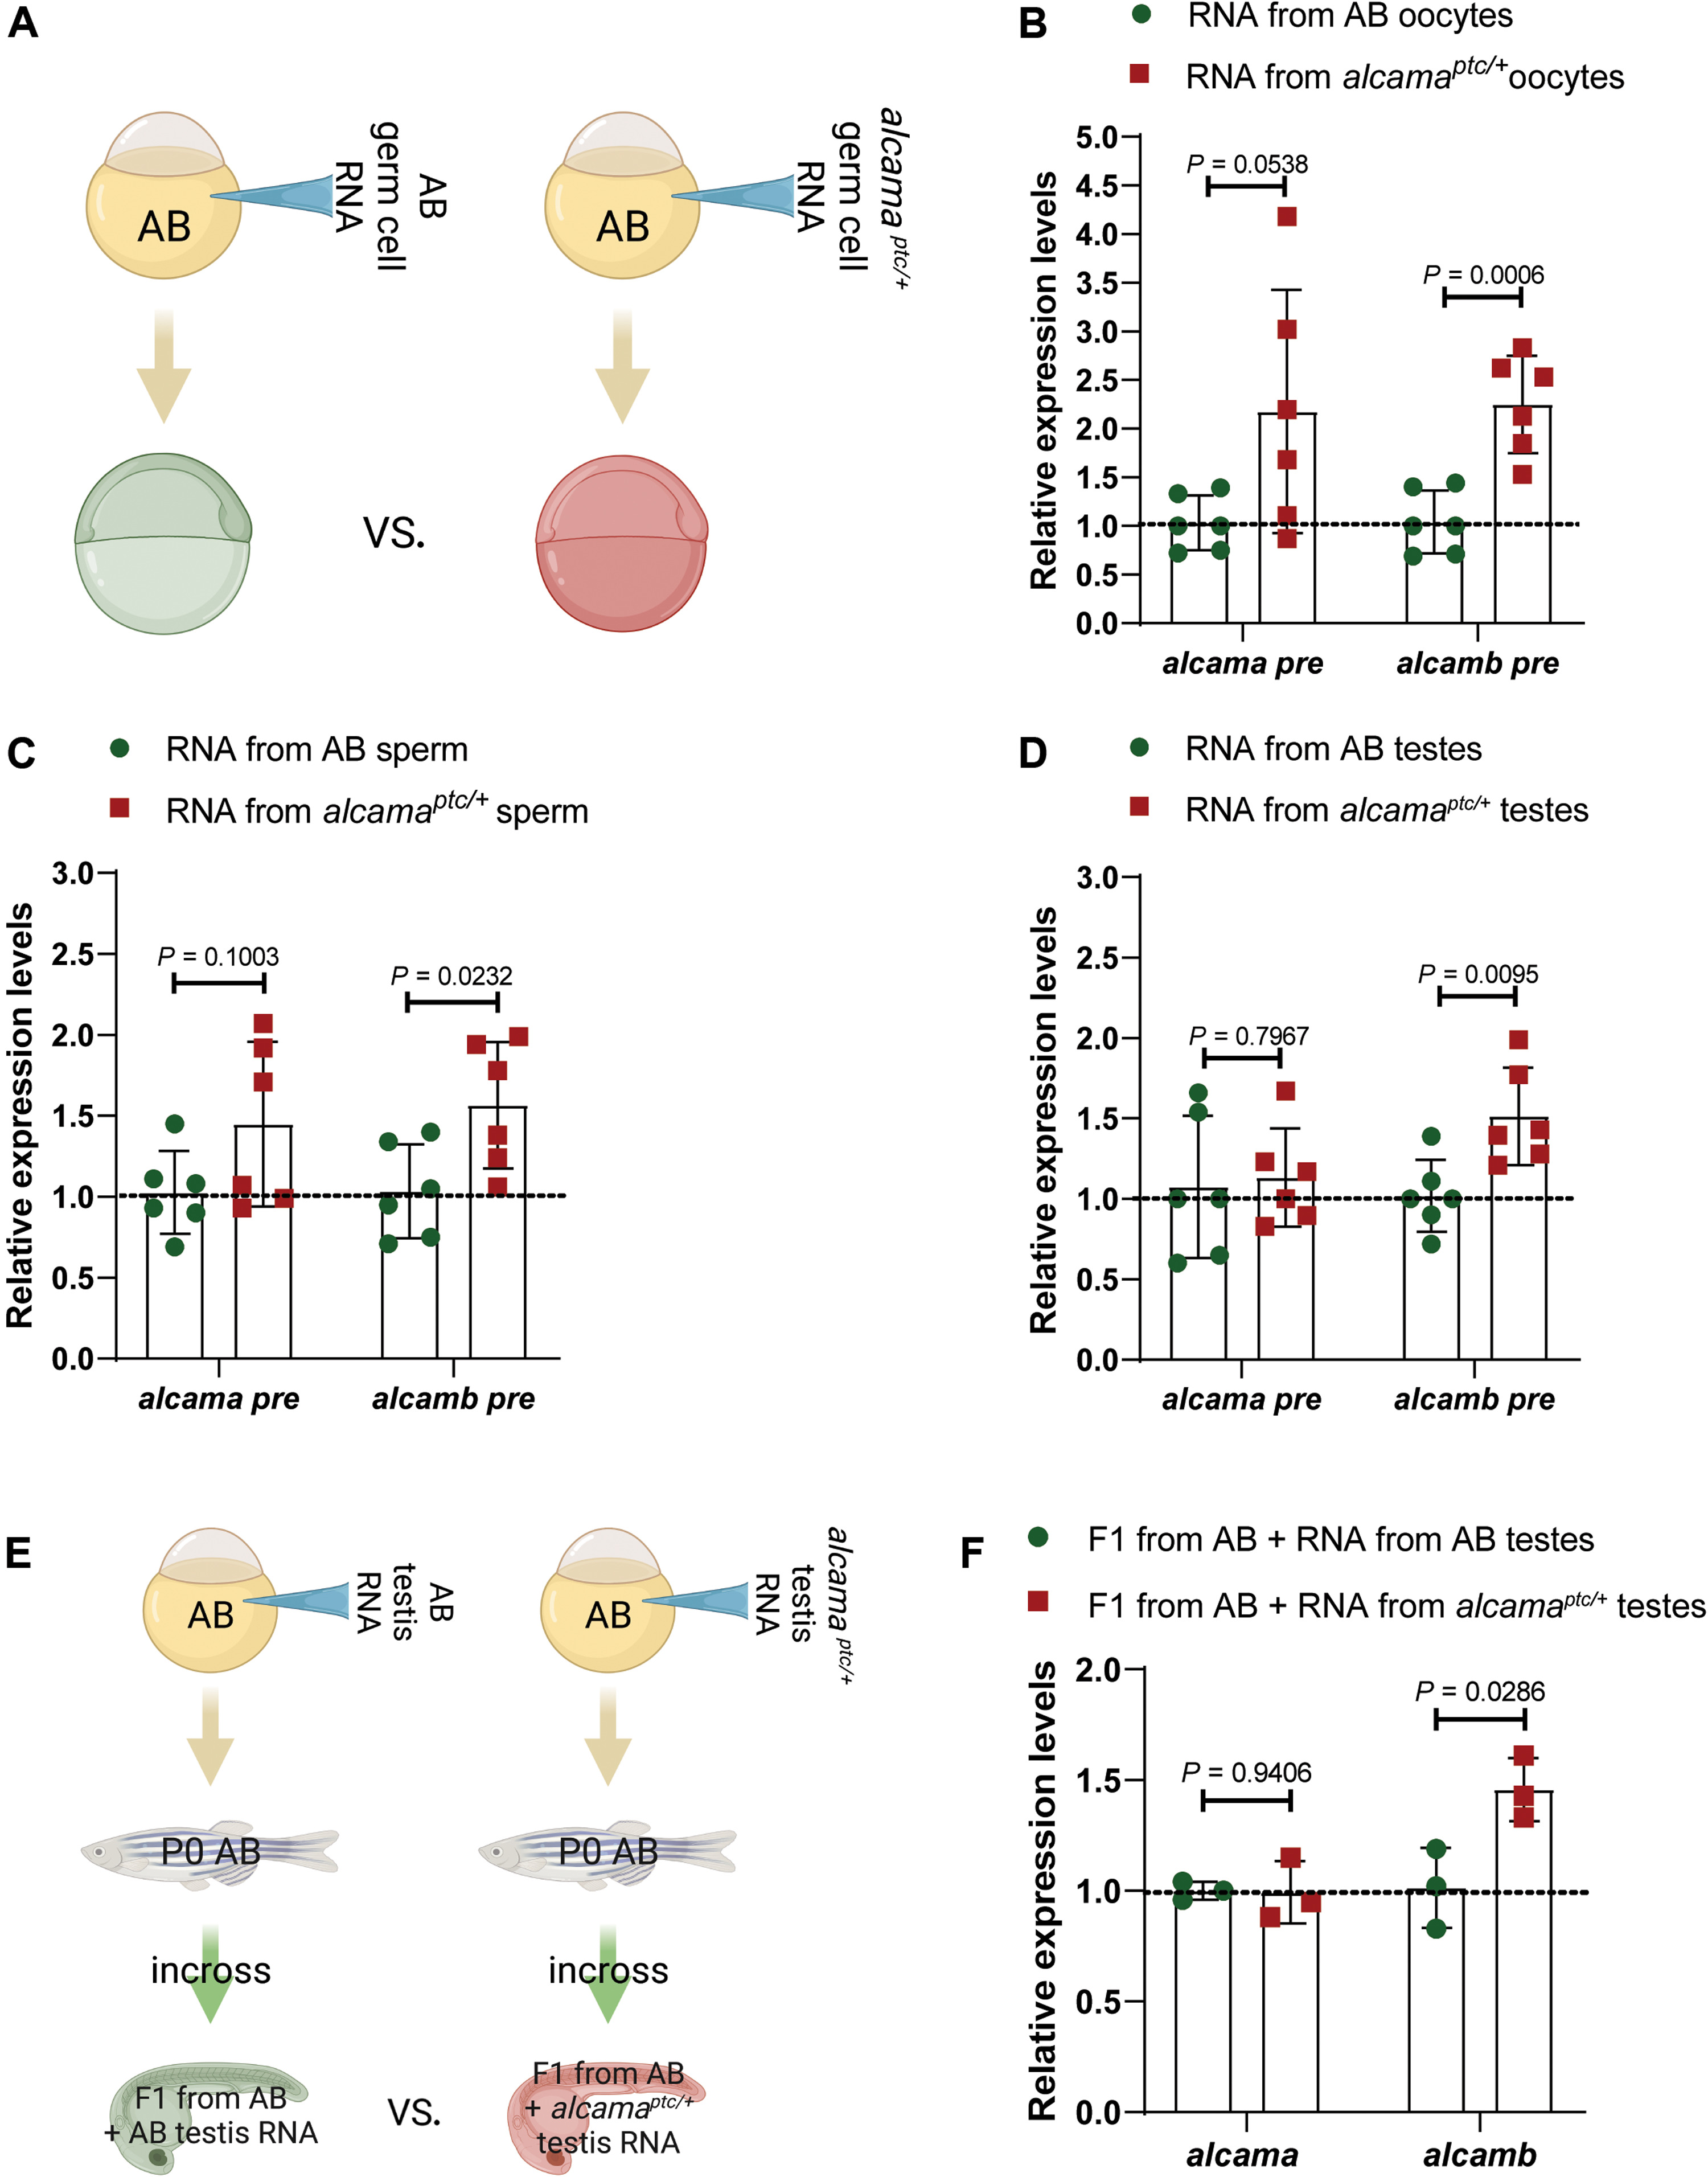
Fig. 4 (A) Schematic representation of the experimental setup. (B) Relative pre-mRNA levels of alcama and alcamb in 6 hpf AB embryos injected with total RNA isolated from oocytes of wild types and alcamaptc/+ zebrafish. (C) Relative pre-mRNA levels of alcama and alcamb in 6 hpf AB embryos injected with total RNA isolated from sperm of wild types and alcamaptc/+ zebrafish. (D) Relative pre-mRNA levels of alcama and alcamb in 6 hpf AB embryos injected with total RNA isolated from testes of wild types and alcamaptc/+ zebrafish. (E) Schematic representation of the experimental setup. (F) Relative mRNA levels of alcama and alcamb in 28 hpf F1 offspring from AB zebrafish injected at the one-cell stage with total RNA isolated from testes of wild types and alcamaptc/+ zebrafish. n ≥ 3 biologically independent samples. Control expression levels were set at 1. Data are means ± SD, and a two-tailed Student’s t test was used to calculate P values. Ct values are listed in table S1. (A) and (E) were created with BioRender.com.