
- Title
-
Zebrafish cornea formation and homeostasis reveal a slow maturation process, similarly to terrestrial vertebrates' corneas
- Authors
- Ikkala, K., Raatikainen, S., Koivula, H., Michon, F.
- Source
- Full text @ Front. Physiol.
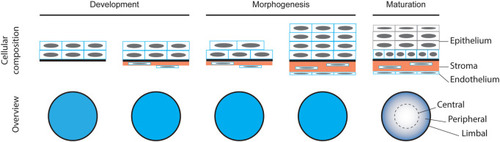
Schematic representation of corneal formation based on the existing literature. |
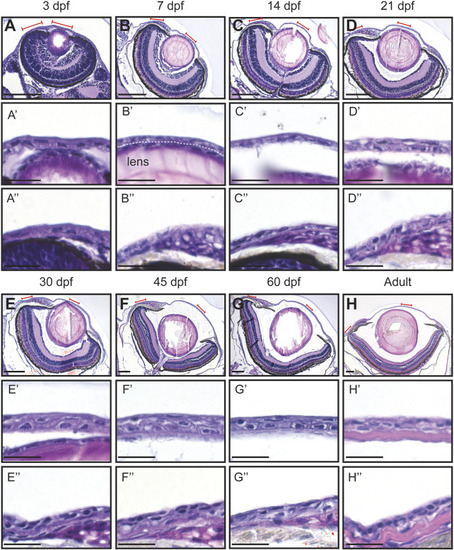
Hematoxylin-eosin staining of the eye in fish of different age (dpf, days post-fertilization). (A–H) Coronal sections of the eye, anterior side on the right. Red lines indicate the regions presented in higher-magnification images. White dashed line in (B′) indicates the border between the lens and the cornea. (A’–H’) Cornea in the central region. (A’’–H’’) Cornea in the periphery/limbus. 3 samples per age group were checked. Scale bars: 100 µm in (A–H), 20 µm in (A’–H’’). |

Stratification of the corneal epithelium. E-cadherin staining on formalin-fixed, paraffin-embedded sections showing the epithelial cell borders in different age groups. 3—5 samples were checked per age group. Scale bars: 20 µm. |

The growth dynamics of the eye and the cornea. (A) Representative SEM images of the eye in fish of different age (dpf, days post-fertilization, 3 samples were checked per age group). (B,C) Total length (B) and eye diameter on anterior-posterior axis (C) (n = 8–12, one-way ANOVA with Sidak’s multiple comparisons test). (D,E) Corneal length on anterior-posterior axis, normalized to the maximum eye diameter, shown in (D) and quantified in (E) (n = 6–10, Kruskal-Wallis test with Dunn’s multiple comparisons test). The results represent mean ± SD. |
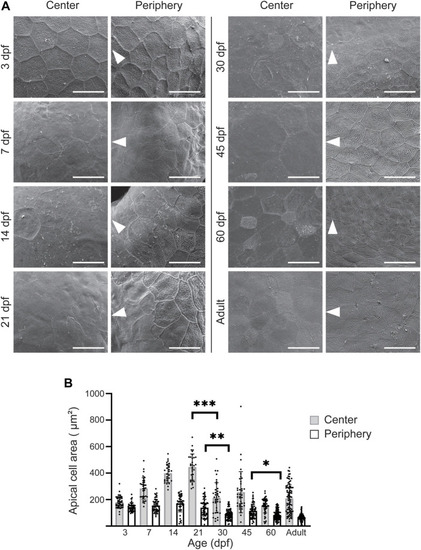
Apical cell appearance on zebrafish cornea. (A) Representative images of the central and peripheral regions. The white arrowheads point to the center of the eye. Scale bars: 20 µm. (B) Quantification of the apical cell area on central (gray) and peripheral (white) cornea. Cells from 3 eyes from 3 animals were pooled per age group for analysis (n = 27–87 in center, 47–121 in periphery, Kruskal-Wallis test with Dunn’s multiple comparisons test). The results represent mean ± SD. |
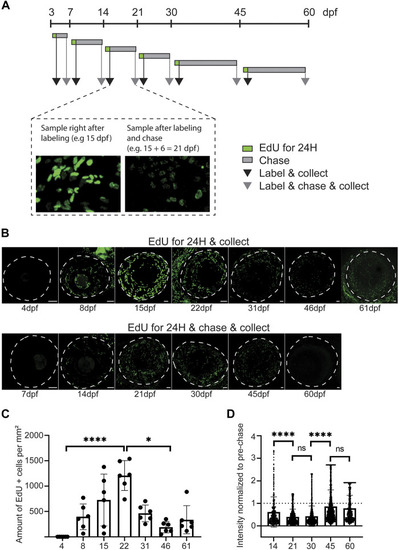
Proliferative activity on zebrafish cornea, as shown by EdU incorporation. (A) EdU was administered to the fish for 24 h at indicated ages. Samples were collected either right after labeling (black arrow), or after chase (grey arrow). (B) Representative images of whole mount samples on intact eyes. Dashed line indicates the eye border. Scale bars: 50 µm. (C) Quantifications of the proliferative activity from 3 to 61 dpf. (C) The EdU + cell amounts on the cornea right after labeling in samples collected at indicated ages. The bars show mean ± SD (n = 6, Kruskal-Wallis test with Dunn’s multiple comparisons test). (D) The mean signal intensity decrease of EdU + cells in samples collected after chase, relative to samples collected before chase. Each cell’s value was normalized to the mean pre-chase value of the labeling group in question. Cells from 3 eyes per group were pooled for analysis. The bars show mean ± SD (n = 383 for 14dpf, 1325 for 21dpf, 2,255 for 30dpf, 1682 for 45dpf, and 570 for 60dpf, Kruskal-Wallis test with Dunn’s multiple comparisons test). |
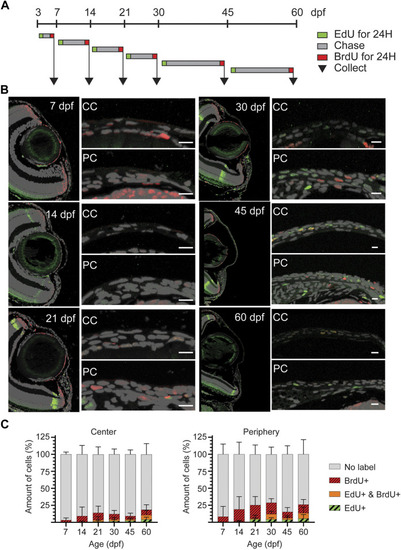
EdU/BrdU double-labeling on zebrafish cornea. (A) EdU (green) was administered to the fish for 24 h, followed by a chase period of 3–15 days. Then, BrdU (red) was administered for 24 h, and samples were collected. (B) EdU (green) and BrdU (red) staining on 5 µm paraffin sections. The panel shows the overview of the anterior eye, and central as well as peripheral/limbal regions of the cornea. (C) Quantification of EdU+, BrdU+, double positive, and EdU/BrdU-negative cells on the central region (left), and the peripheral region (right). Results represent mean ± SD (n = 6–9). The mean value of 2—3 sections from the middle of the eye were used per fish. Scale bars: 20 µm. CC, central regions; PC, peripheral/limbal region. |

Corneal innervation in different age groups. Acetylated tubulin whole mount staining on maximum intensity projection images of whole eyes (A–F) and in central regions (A′–F′). Additionally, the peripheral/limbal region is shown for adult stage (F''). Orange color indicates the signal on the entire corneal tissue, yellow refers to the epithelial compartment, and red to the stromal compartment. During the first 1.5 months (A′–D′) the signal remains scarse on central cornea; the thickest neuronal branches can be observed in the peripheral regions (A–D). At 60 dpf, the innervation is getting more dense, and distinct stromal (red) and epithelial (yellow) processes can be identified (E,E′). In the adult cornea, thick peripheral nerve fibers branch and enter the epithelial compartment, forming an even, centrally-oriented pattern (F–F). The epithelial versus stromal fibers organize to distinguishable networks (F′,F). Three samples were checked per age group. Scale bars: 100 µm in the overview images, 10 µm in the magnified images. |

Expression of pax6a (red) and krtt1c19e (yellow) during corneal maturation. RNAScope in situ hybridization on 5- µm sections, red lines indicate areas in magnified images in center and periphery. Dashed line indicates the border between lens epithelium and cornea. 3 samples were checked per age group. Scale bars: 100 µm in the overview images, 20 µm in the magnified views. EXPRESSION / LABELING:
|
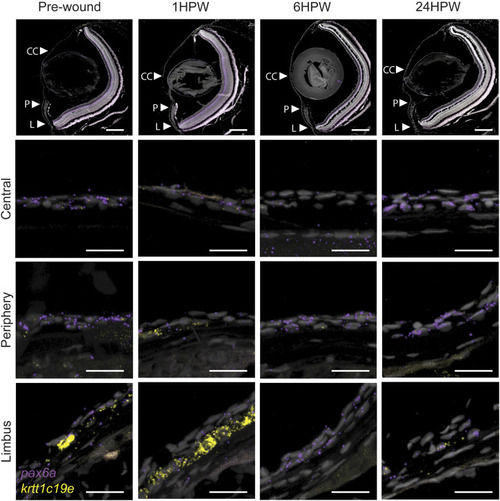
Gene expression changes in adult wound healing. RNAScope in situ hybridization on 5- µm sections showing the expression of pax6a (red) and krtt1c19e (yellow) before, and after 1, 6, or 24 h, an epithelial abrasion on central cornea. 3 samples were checked per age group. Scale bars: 200 µm in the overview images, 20 µm in the magnified views. |
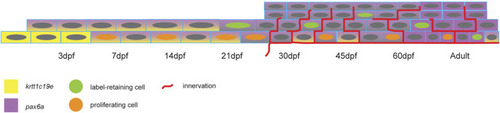
Scheme showing the change of pax6a and krtt1c19e expression, the appearance of proliferating and label-retaining cells, and the establishment of pronounced corneal innervation. |

ZFIN is incorporating published figure images and captions as part of an ongoing project. Figures from some publications have not yet been curated, or are not available for display because of copyright restrictions. EXPRESSION / LABELING:
|