
|
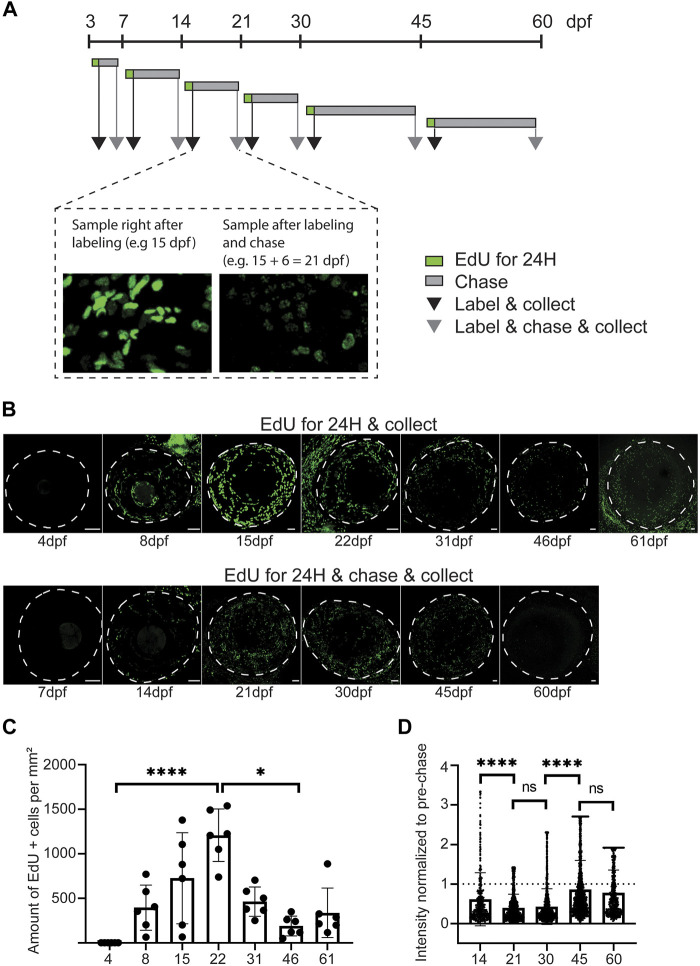
FIGURE 6 Proliferative activity on zebrafish cornea, as shown by EdU incorporation. (A) EdU was administered to the fish for 24 h at indicated ages. Samples were collected either right after labeling (black arrow), or after chase (grey arrow). (B) Representative images of whole mount samples on intact eyes. Dashed line indicates the eye border. Scale bars: 50 µm. (C) Quantifications of the proliferative activity from 3 to 61 dpf. (C) The EdU + cell amounts on the cornea right after labeling in samples collected at indicated ages. The bars show mean ± SD (n = 6, Kruskal-Wallis test with Dunn’s multiple comparisons test). (D) The mean signal intensity decrease of EdU + cells in samples collected after chase, relative to samples collected before chase. Each cell’s value was normalized to the mean pre-chase value of the labeling group in question. Cells from 3 eyes per group were pooled for analysis. The bars show mean ± SD (n = 383 for 14dpf, 1325 for 21dpf, 2,255 for 30dpf, 1682 for 45dpf, and 570 for 60dpf, Kruskal-Wallis test with Dunn’s multiple comparisons test).