
|
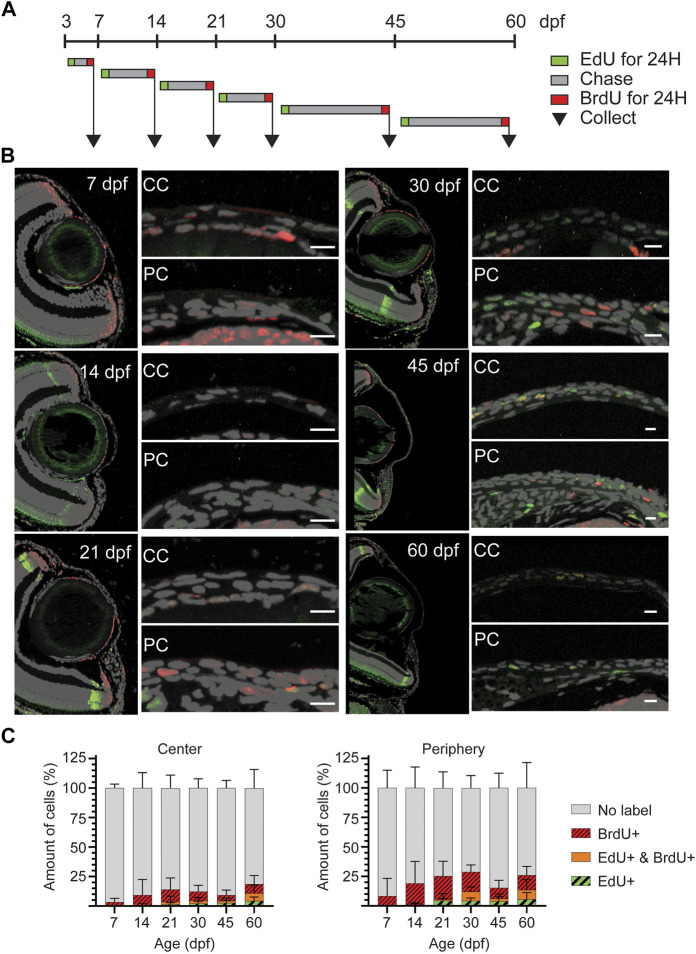
FIGURE 7 EdU/BrdU double-labeling on zebrafish cornea. (A) EdU (green) was administered to the fish for 24 h, followed by a chase period of 3–15 days. Then, BrdU (red) was administered for 24 h, and samples were collected. (B) EdU (green) and BrdU (red) staining on 5 µm paraffin sections. The panel shows the overview of the anterior eye, and central as well as peripheral/limbal regions of the cornea. (C) Quantification of EdU+, BrdU+, double positive, and EdU/BrdU-negative cells on the central region (left), and the peripheral region (right). Results represent mean ± SD (n = 6–9). The mean value of 2—3 sections from the middle of the eye were used per fish. Scale bars: 20 µm. CC, central regions; PC, peripheral/limbal region.