FIGURE SUMMARY
Title

A new software tool for computer assisted in vivo high-content analysis of transplanted fluorescent cells in intact zebrafish larvae

Authors
Førde, J.L., Reiten, I.N., Fladmark, K.E., Kittang, A.O., Herfindal, L.
Source
Full text @ Biol. Open

Processing of confocal images derived from zebrafish larvae intravenously injected with fluorescent cells. The workflow for segmenting cells from confocal images is illustrated in A. Acquired confocal images are first flattened to a 2D representation to enable easy visual analysis. Following flattening, the larval boundaries are selected by the user to determine the location and orientation of the larva. Using this information, the larvae are segmented and realigned to a standardised orientation. Background levels are determined by the user and all objects located within the larva are segmented using a watershed algorithm. Next, the data can be exported for further analysis. An example of the cell segmentation is given in B and C. A zebrafish larva was injected with 4 nL of a 10 106 cells·ml−1 CellTracker™ Deep Red-stained cancer cell suspension into the posterior cardinal vein at 2 dpf. A 2D representation of a confocal image acquired the day after cell injection is shown in B. Common sources of autofluorescence that need to be masked prior to segmentation are the gut, yolk sack and iridophores as indicated by black arrows. Cell segmentation of the tail region (indicated by the black rectangle in B) is displayed in C. To illustrate the segmentation, each segmented object detected is represented by a unique colour.

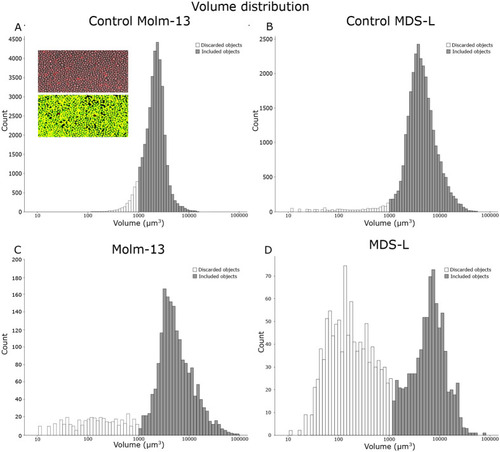
In vitro and in vivo measurement of cancer cell volume distributions based on confocal images. Cultured Molm-13 AML and MDS-L cells were stained with CellTracker™ Deep Red and imaged by confocal microscopy (A and B, respectively). An illustration of the segmentation process is shown as inset in A, with the composite fluorescence and brightfield image shown at the top and the resulting segmentation below (composite image of red fluorescence and segmented overlay in green). The plots illustrate the volume distribution with objects below the volume threshold of 1000 µm3 shown in white and above in grey. For volume distributions of cancer cells in zebrafish larvae, 4 nL of 10 106 cells·ml−1 CellTracker™ Deep Red-stained cancer cell suspensions were injected into the posterior cardinal vein of 18 zebrafish larvae at 2 dpf. Following cell injection, the larvae were imaged by confocal microscopy, and the images processed as the control samples in A and B. Volume distributions for the cell lines Molm-13 and MDS-L in zebrafish larvae are given in C and D, respectively. Using the volume distribution from A and B, a lower volume cut-off for viable cells was determined. The cell populations above and below this threshold are shown in grey and white, respectively. The plots are combined numbers from 3 images in A and B, and 9 larvae for each group in C and D. An illustration of the inter-larvae variation is given in Fig. S3.

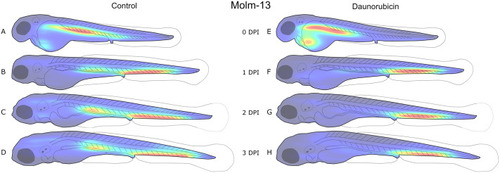
Distribution of Molm-13 cells in zebrafish larvae after intravenous injection with daunorubicin. 4 nL of a 10 106 cells·ml−1 CellTracker™ Deep Red-stained Molm-13 cell suspension was injected into 18 zebrafish larvae at 2 dpf, and either left untreated (A-D, n=9) or treated with a 4 nL injection of 1 mM daunorubicin (E-H, n=9). Each larva was imaged daily using confocal microscopy, and the images analysed using our ImageJ plugin as described in the Materials and Methods section. The location of each cell above the volume threshold determined in Fig. 2C was used to create a combined distribution map for each group on each dpi. The density map was generated using MATLAB and visualises the areas of highest (red) and lowest (blue) cell density. Each density map is normalised to its own highest and lowest values; thus, it only visualises distribution, not total tumour burden. An illustration of the variation between replicates is given in Fig. S4.

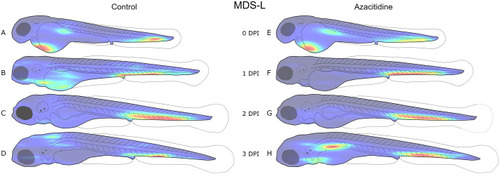
Distribution of MDS-L cells in zebrafish larvae after intravenous injection with azacitidine. 4 nL of a 10 106 cells·ml−1 CellTracker™ Deep-Red-stained MDS-L cell suspension was injected into 18 zebrafish larvae at 2 dpf, and either left untreated (A-D, n=9) or treated with daily 4 nL injections of 1 mM azacitidine (E-H, n=9). Each larva was imaged daily using confocal microscopy, and the images analysed using our ImageJ plugin as described in the Materials and Methods section. The location of each cell above the volume threshold determined in Fig. 2D was used to create a combined distribution map for each group on each dpi. The density map was generated using MATLAB and visualises the areas of highest (red) and lowest (blue) cell density. Each density map is normalised to its own highest and lowest values; thus, it only visualises distribution, not total tumour burden. An illustration of the variation between replicates is given in Fig. S4C and D.

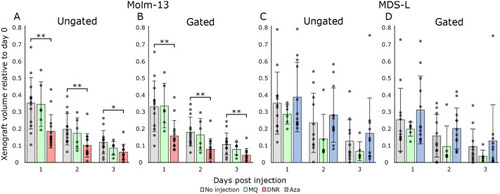
Tumour burden of Molm-13 and MDS-L in zebrafish larvae with or without anti-cancer treatment. Molm-13 and MDS-L cells were stained with CellTracker™ Deep-Red and 4 nL of a 10 106 cells·ml−1 suspension engrafted into zebrafish larvae 2 dpf by injection into the posterior cardinal vein. Following engraftment, the larvae were imaged daily using spinning disk confocal microscopy. Treatment of Molm-13 cell-xenografted larvae consisted of a single 4 nL 1 mM daunorubicin injection at the day of the transplant, whereas MDS-L engrafted larvae were given daily injections of 4 nL 1 mM azacitidine. Control samples consisted of transplanted larvae without injection as well as larvae injected with 4 nL Milli-Q® water at the day of transplantation for Molm-13 and daily for MDS-L. Imaging and treatment were continued until the larvae reached 5 dpf. Using our software tool, fluorescent cells were counted and segmented based on the confocal images. The total volume of all segmented objects in larvae engrafted with Molm-13 and MDS-L are shown in A and C, respectively. Using the volume threshold of 1000 µm3 determined from the images in Fig. 2C and D, the filtered total cell volume was determined (B and D). n=15 except for MQ-injected larvae, where n=6. Significance between injected larvae and non-injected controls were found using two-tailed Welch's t-test. Not annotated: P>0.05, *P≤0.05, **P≤0.01.

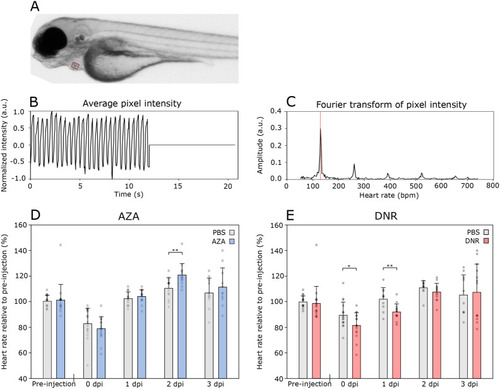
Aza and DNR effects on zebrafish heart rate. The zebrafish larvae heart rate in the cardiotoxicity assays was found by filming the zebrafish for 12 s and using a self-written ImageJ macro to calculate the heart rate from the obtained video as described in the Materials and Methods section. (A) Still image from a film analysing zebrafish larvae heart rate. The red rectangle marking the region of interest (ROI) for pixel intensity measurement. (B) Average pixel intensity in the ROI. (C) Fourier transform of pixel intensity from the ROI to calculate beats per minute (BPM). (D) Heart rate of zebrafish larvae injected with 4 nL PBS (n=11) or Aza (1 mM, n=11). (E) Heart rate of zebrafish larvae injected with 4 nL PBS (n=10) or DNR (1 mM, n=13). For the Aza-test, the zebrafish larvae were injected daily after Pre-injection, 1 dpi and 2 dpi measurements. For the DNR-test, the zebrafish larvae were injected once, after the Pre-injection observation. The heart rate was related to the average heart rate of the control group pre-injection. Significance found using two-tailed Welch's t-test. Not annotated: P>0.05, *P≤0.05, **P≤0.01.

Overview of the zebrafish larva. A zebrafish larva imaged at 4 dpf using bright field microscopy. The arrows indicate the eyes (A), otolith (B), heart (C), gut (D) and yolk sac (E). Intravenous injections were performed in the posterior cardinal vein (F) down-stream from the caudal vein (G).

Acknowledgments
This image is the copyrighted work of the attributed author or publisher, and ZFIN has permission only to display this image to its users. Additional permissions should be obtained from the applicable author or publisher of the image. Full text @ Biol. Open