IMAGE

Fig. 2.

ID
ZDB-IMAGE-221226-293
Source
Figures for Førde et al., 2022
Image
Figure Caption

Fig. 2.

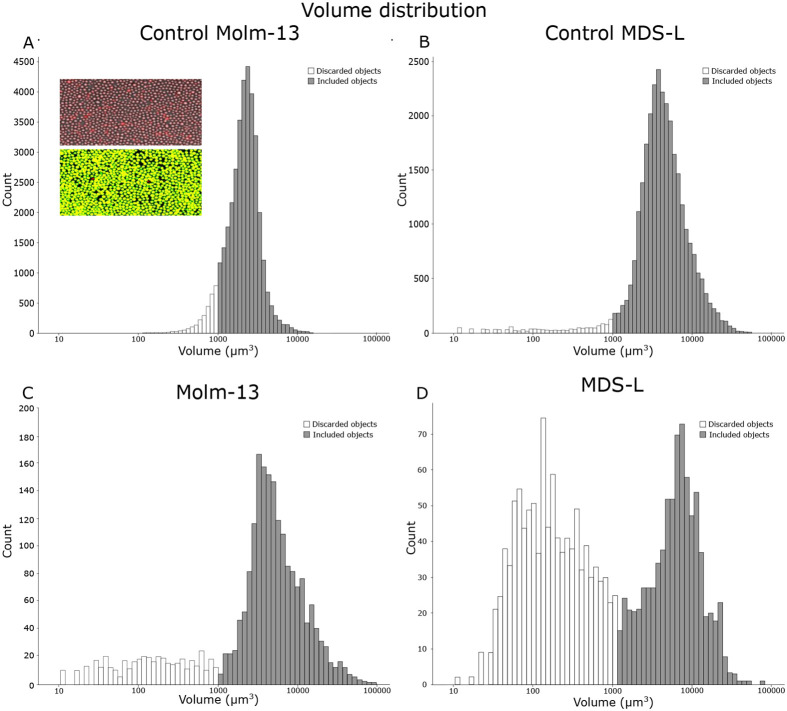
In vitro and in vivo measurement of cancer cell volume distributions based on confocal images. Cultured Molm-13 AML and MDS-L cells were stained with CellTracker™ Deep Red and imaged by confocal microscopy (A and B, respectively). An illustration of the segmentation process is shown as inset in A, with the composite fluorescence and brightfield image shown at the top and the resulting segmentation below (composite image of red fluorescence and segmented overlay in green). The plots illustrate the volume distribution with objects below the volume threshold of 1000 µm3 shown in white and above in grey. For volume distributions of cancer cells in zebrafish larvae, 4 nL of 10 106 cells·ml−1 CellTracker™ Deep Red-stained cancer cell suspensions were injected into the posterior cardinal vein of 18 zebrafish larvae at 2 dpf. Following cell injection, the larvae were imaged by confocal microscopy, and the images processed as the control samples in A and B. Volume distributions for the cell lines Molm-13 and MDS-L in zebrafish larvae are given in C and D, respectively. Using the volume distribution from A and B, a lower volume cut-off for viable cells was determined. The cell populations above and below this threshold are shown in grey and white, respectively. The plots are combined numbers from 3 images in A and B, and 9 larvae for each group in C and D. An illustration of the inter-larvae variation is given in Fig. S3.

Acknowledgments
This image is the copyrighted work of the attributed author or publisher, and ZFIN has permission only to display this image to its users. Additional permissions should be obtained from the applicable author or publisher of the image. Full text @ Biol. Open