|
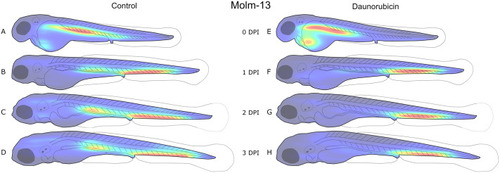
Distribution of Molm-13 cells in zebrafish larvae after intravenous injection with daunorubicin. 4 nL of a 10 106 cells·ml−1 CellTracker™ Deep Red-stained Molm-13 cell suspension was injected into 18 zebrafish larvae at 2 dpf, and either left untreated (A-D, n=9) or treated with a 4 nL injection of 1 mM daunorubicin (E-H, n=9). Each larva was imaged daily using confocal microscopy, and the images analysed using our ImageJ plugin as described in the Materials and Methods section. The location of each cell above the volume threshold determined in Fig. 2C was used to create a combined distribution map for each group on each dpi. The density map was generated using MATLAB and visualises the areas of highest (red) and lowest (blue) cell density. Each density map is normalised to its own highest and lowest values; thus, it only visualises distribution, not total tumour burden. An illustration of the variation between replicates is given in Fig. S4.
|