
- Title
-
Dynamically regulated focal adhesions coordinate endothelial cell remodelling in developing vasculature
- Authors
- Chau, T.C.Y., Keyser, M.S., Da Silva, J.A., Morris, E.K., Yordanov, T.E., Duscyz, K.P., Paterson, S., Yap, A.S., Hogan, B.M., Lagendijk, A.K.
- Source
- Full text @ Development
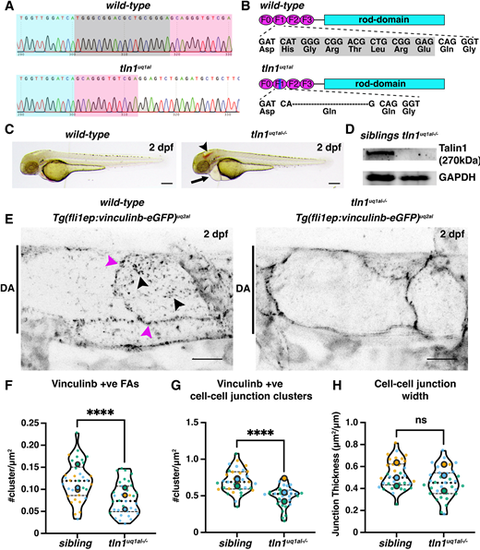
Novel zebrafish models for studying focal adhesion function and dynamics in live vasculature. (A) Chromatograms of genomic sequencing of a wild-type sibling embryo (top) and a homozygous tln1uq1al−/− mutant (bottom). Bases highlighted in grey in the wild type are deleted in tln1uq1al−/− mutants. (B) Schematics of Talin 1 protein showing the 18 bp deletion in tln1uq1al−/− resulting in an in-frame deletion of six amino acids (His-Gly-Arg-Thr-Leu-Arg) and a Glu-to-Gln substitution in the F1 FERM domain. (C) Bright-field images showing body morphology of a wild-type sibling versus a tln1uq1al−/− mutant at 2 dpf. Arrowhead indicates cranial haemorrhaging in the mutant. Arrow indicates cardiac oedema in the mutant. Scale bars: 100 µm. (D) Western blot analysis at 3 dpf showing loss of Talin 1 in tln1uq1al−/− mutants. (E) Expression of Vinculinb-eGFP at FAs (black arrowheads) and at cell-cell junctions (magenta arrowheads) in the dorsal aorta (DA) of a wild-type sibling at 2 dpf (left). In tln1uq1al−/− mutants (right), expression at FAs in greatly reduced, while a diffuse presence of Vinculinb-eGFP is observed at cell-cell junctions. Scale bars: 10 µm. (F) Number of Vinculinb-eGFP-positive FA clusters, n=3 replicates: n=23 ECs siblings and n=18 ECs tln1uq1al−/− mutants (****P<0.0001, unpaired t-test ). (G) Number of Vinculinb-eGFP-positive clusters at cell-cell junctions, n=3 replicates: n=23 ECs siblings and n=18 ECs tln1uq1al−/− mutants (****P<0.0001, unpaired t-test ). (H) Quantification of cell-cell junction width based on Vinculin-eGFP expression, n=3 replicates: n=23 ECs siblings and n=18 ECs tln1uq1al−/− mutants, no significant difference (ns) (unpaired t-test). Replicate averages are depicted by large circles; smaller circles indicate individual data points of each replicate (colour matched). EXPRESSION / LABELING:
PHENOTYPE:
|
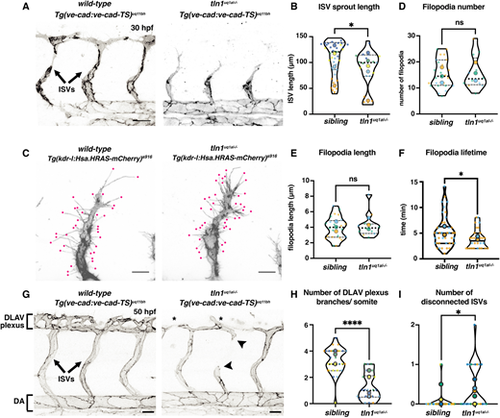
Focal adhesion function is required for efficient angiogenic sprouting and network maintenance. (A) Trunk vasculature of a Tg(ve-cad:ve-cad-TS)-positive wild-type sibling and a tln1uq1al−/− mutant embryo at 30 hpf. ISV sprouts are indicated. Scale bars: 50 µm. (B) Quantification of ISV sprout length, showing a mild reduction in mutants, n=5 replicates: n=39 ISVs in siblings and n=19 ISVs in tln1uq1al−/− mutants (*P<0.05, Mann–Whitney test). (C) High-resolution live image showing filopodial extensions at the sprouting front of an ISV in a wild-type sibling and in tln1uq1al−/− mutant embryo at 30 hpf. Embryos express Tg(kdrl:Hsa.HRAS-mCherry)s916, labelling the EC membrane. Scale bars: 10 µm. (D,E) Quantification of filopodia number (D) and length (E) at the tip of ISV sprouts, n=3 replicates: n=24 filopodia in siblings and n=12 filopodia in tln1uq1al−/− mutants, no significant difference (ns) (unpaired t-test) . (F) Lifetime (min) of filopodia at the sprouting tip. Lifetime is time between emergence and full retraction of a single filopodia, n=2 replicates: n=42 filopodia in siblings and n=30 filopodia in tln1uq1al−/− mutants (*P<0.05, Mann–Whitney test). (G) Trunk vasculature of a Tg(ve-cad:ve-cad-TS)-positive wild-type sibling and a tln1uq1al−/− mutant embryo at 50 hpf, showing reduced DLAV plexus formation (asterisks) and disconnected ISVs (arrowheads) in the mutant. Scale bars: 50 µm. (H) Quantification of the number of DLAV branches per somite, n=5 replicates: n=29 siblings and n=22 tln1uq1al−/− mutants (****P<0.0001, unpaired t-test). (I) Quantification of the number of disconnected ISVs across the width of two somites, located above the yolk extension, n=5 replicates: n=29 siblings and n=22 tln1uq1al−/− mutants (*P<0.05, Mann–Whitney test). In all graphs, replicate averages are depicted by large circles; smaller circles indicate individual data points of each replicate (colour matched). |
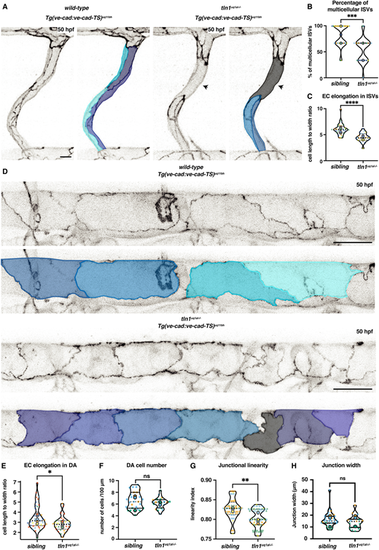
Loss of focal adhesions impairs endothelial cell remodelling. (A) Single ISVs of a wild-type sibling and in tln1uq1al−/− mutant embryo at 50 hpf, expressing VE-cadherin Tg(ve-cad:ve-cad-TS). False-coloured images indicate EC shapes. Arrowheads indicate a region of the ISV that is unicellular in the mutant. Scale bar: 10 µm. (B) Quantification of the percentage of multicellular ISVs per two somites, n=5 replicates: n=31 siblings and n=22 tln1uq1al−/− mutants (***P<0.001, Mann–Whitney test). (C) Quantification of EC elongation in ISVs, n=5 replicates: n=31 siblings and n=22 tln1uq1al−/− mutants (****P<0.0001, Mann–Whitney test). (D) Dorsal aorta (DA) of a wild-type sibling and a tln1uq1al−/− mutant embryo at 50 hpf, expressing VE-cadherin Tg(ve-cad:ve-cad-TS). False-coloured duplicate images indicate EC shapes. Scale bars: 25 µm. (E) Quantification of EC elongation in the DA, n=6 replicates: n=41 siblings and n=30 tln1uq1al−/− mutants (*P<0.05, Mann–Whitney test). (F) Number of ECs in the DA, quantified over a 100 µm region, n=3 replicates: n=31 sibling ECs and n=17 tln1uq1al−/− mutant ECs, no significant difference (ns) (Mann-Whitney test). (G) Quantification of junctional linearity of ECs in the DA, n=6 replicates: n=20 siblings and n=21 tln1uq1al−/− mutants (**P<0.01, unpaired t-test). (H) Quantification of junction width measured by VE-cadherin-TS expression, n=3 replicates: n=31 siblings and n=16 tln1uq1al−/− mutants, no significant difference (ns) (Mann-Whitney test). In all graphs, replicate averages are depicted by large circles; smaller circles indicate individual data points of each replicate (colour matched). |
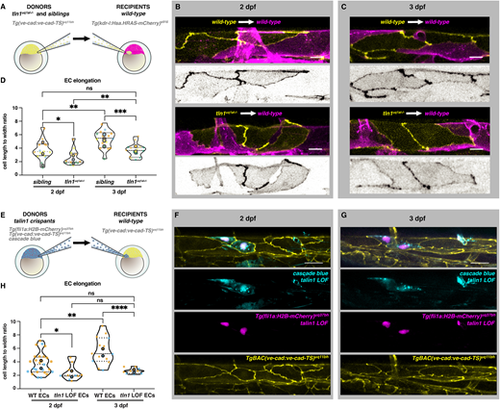
Talin 1 is required for endothelial cell elongation cell-autonomously. (A) Schematic representation of transplantation procedure. For these experiments, we transplanted cells at blastula stage from Tg(ve-cad:ve-cad-TS)uq11bh donors to Tg(kdrl:Hsa.HRAS-mCherry)s916 recipients. (B) Wild-type dorsal aorta (magenta) of recipient embryos at 2 dpf containing either wild-type donor ECs (top, yellow) or tln1uq1al−/− mutant ECs (bottom, yellow). Scale bars: 10 µm. Greyscale images show donor ECs only. (C) Wild-type recipient dorsal aorta (magenta) of recipient embryos at 3 dpf containing wild-type donor ECs (top, yellow) or tln1uq1al−/− mutant ECs (bottom, yellow). Scale bars: 10 µm. Greyscale images show donor ECs only. (D) Quantification of EC elongation of transplanted ECs during dorsal aorta maturation from 2 dpf to 3 dpf, n=4 replicates; 2 dpf data, n=15 sibling ECs and n=14 tln1uq1al−/− mutant ECs; 3 dpf data, n=15 sibling ECs and n=15 tln1uq1al−/− mutant ECs. *P<0.05 for 2 dpf sibling versus tln1uq1al−/− mutant (Mann-Whitney test). ***P<0.001 for 3 dpf sibling versus 3 dpf tln1uq1al−/− mutant (unpaired t-test). **P<0.01 for 2 dpf sibling versus 3 dpf sibling (Mann-Whitney test). **P<0.01 for 2 dpf tln1uq1al−/− mutant versus 3 dpf tln1uq1al−/− mutant (Mann-Whitney test). (E) Schematic representation of complementary transplantation experiments. We transplanted cells from Cascade Blue-injected tln1 crispants carrying two transgenes: Tg(ve-cad:ve-cad-TS)uq11bh and Tg(fli1ep:nls-mCherry)uq37bh. Cells were transplanted into Tg(ve-cad:ve-cad-TS)uq11bh wild-type embryos at blastula stages. (F) A small graft of Tln1-deficient ECs [indicated by Cascade Blue and Tg(fli1ep:nls-mCherry)uq37bh expression] within a wild-type DA at 2 dpf. Scale bar: 25 µm. (G) Endothelial-restricted Tln1-deficient ECs, imaged at 3 dpf. Scale bar: 25 µm. (H) Quantifications of EC shape of Tln1-deficient donor cells versus neighbouring wild-type ECs at 2 and 3 dpf, showing that Tln1-deficient cells fail to elongate while neighbouring ECs are unaffected and elongate significantly over time. Graphs show replicate averages (large circles); smaller circles indicate individual data points of each replicate (colour matched), n=2 replicates; 2 dpf data, n=25 wild-type ECs and n=11 tln1uq1al−/− mutant ECs; 3 dpf data, n=14 wild-type ECs and n=10 tln1uq1al−/− mutant ECs. Mann-Whitney test for all comparisons (*P<0.01, **P<0.005, ****P<0.0001). |

Actin polymerisation induces replicated endothelial cell remodelling phenotypes. (A) Bright-field images showing the overall body morphology at 50 hpf of embryos upon 5 h treatment with either 0.4% DMSO (control, left) or with 75 μM CK666 (Arp2/3 inhibitor, right). CK666-treated embryos develop cranial haemorrhaging (arrowhead), reminiscent of tln1uq1al−/− mutants (Fig. 1A). Scale bar: 100 µm. (B) Maximum projection of the dorsal aorta at 50 hpf, directly after treatment with either DMSO (control, top) or CK666 (bottom), showing impaired EC elongation. Duplicate images, one with false-coloured ECs to highlight EC shape. The colours present a spectrum: lighter colours indicate more elongated ECs. Scale bar: 25 µm. (C) Quantification of EC elongation at 50 hpf, showing a significant reduction upon CK666 treatment, n=3 replicates: n=48 DMSO- and n=48 CK666-treated embryos (Mann–Whitney test, ****P<0.0001). (D) Quantification of cell-cell junction linearity at 50 hpf, showing a significant reduction upon CK666 treatment, n=3 replicates: n=48 DMSO- and n=48 CK666-treated embryos (unpaired t-test, ****P<0.0001). (E) Still images from time-lapse imaging (Movie 8). Movie records cortical F-actin rearrangements in wild-type (top) and tln1uq1al−/− mutant ECs (bottom) from 48 to 49 hpf. (Left) Temporal colour-coded projection of 13 timepoints imaged during the 1 h time-lapse. (Middle) Greyscale images of F-actin expression at the start (t=0) and the end of the movie (t=13). (Right) Overlay of t=0 (cyan) and t=13 (yellow) showing F-actin displacement in the wild type and very little movement in tln1uq1al−/− mutant. Scale bar: 5 μm. (F) Quantification of F-actin displacements of cortical F-actin over the course of a 1-h time-lapse movie in siblings (magenta) and tln1uq1al−/− mutants (black) (Mann-Whitney test, ***P<0.001). Each data point represents the average displacement between two consecutive time-points, n=3 replicates: n=20 siblings and n=14 tln1uq1al−/− mutants. In C and D, replicate averages are depicted by large circles; smaller circles indicate individual data points of each replicate (colour matched). |
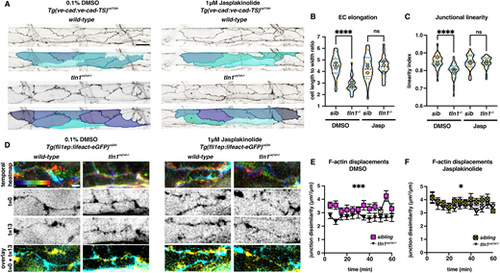
Enhancing polymerised F-actin can restore EC elongation, junctional linearity and F-actin rearrangements in tln1uq1al−/− mutants. (A) Maximum projection of the dorsal aorta at 50 hpf, directly after treatment with either 0.1% DMSO (control, left) or 1 μM jasplakinolide (Jasp, right) showing impaired EC elongation in DMSO-treated tln1uq1al−/− mutants (bottom left), which is rescued when mutants have been exposed to Jasp (bottom right). The colours present a spectrum: lighter colours indicate more elongated ECs. Scale bar: 25 µm. (B) Quantification of EC elongation at 50 hpf, showing the phenotypic rescue of EC elongation in Jasp-treated tln1uq1al−/− mutants (n=3 replicates): n=27 siblings and n=25 tln1uq1al−/− mutants in DMSO-treated group; n=27 siblings and n=22 tln1uq1al−/− mutants in Jasp-treated group. ****P<0.0001 for DMSO sibling versus tln1uq1al−/− mutant (Mann-Whitney test). For Jasp sibling versus tln1uq1al−/− mutant, no significant difference (ns) (t-test). (C) Quantification of junctional linearity at 50 hpf, showing significant rescue of linearisation in Jasp-treated tln1uq1al−/− mutants, n=3 replicates: n=27 siblings and n=33 tln1uq1al−/− mutants in DMSO-treated group; n=28 siblings and n=25 tln1uq1al−/− mutants in Jasp-treated group. ****P<0.0001 for DMSO sibling versus tln1uq1al−/− mutant (Mann-Whitney test). For Jasp sibling versus tln1uq1al−/− mutant, no significant difference (ns) (Mann–Whitney test). (D) Stills from time-lapse imaging (Movies 9 and 10) of cortical F-actin displacements in 0.1% DMSO (control, left) or 1 μM Jasp-treated (right) wild-type siblings and tln1uq1al−/− mutant embryos. Each column of images is organised as follows: top, temporal colour-coded projection of 13 timepoints imaged during the hour time-lapse; middle, greyscale images of F-actin expression at the start (t=0) and the end of the movie (t=13); bottom, overlay of t=0 (cyan) and t=13 (yellow) showing F-actin displacement. Scale bar: 5 μm. (E) Quantification of cortical F-actin displacement over the course of a 1 h time-lapse movie in 0.1% DMSO-treated siblings (yellow) and tln1uq1al−/− mutants (black). Scale bar: 10 µm. ***P<0.001 (Mann-Whitney test). (F) Quantification of cortical F-actin displacements over the course of a 1 h time-lapse movie in Jasp-treated siblings (yellow) and tln1uq1al−/− mutants (black) showing a partial rescue when compared with E, n=3 replicates: n=12 siblings and n=12 tln1uq1al−/− mutants in DMSO-treated group; n=14 siblings and n=10 tln1uq1al−/− mutants in Jasp-treated group (*P<0.05, Mann–Whitney test). In B and C, replicate averages are depicted by large circles; smaller circles indicate individual data points of each replicate (colour matched). |