
|
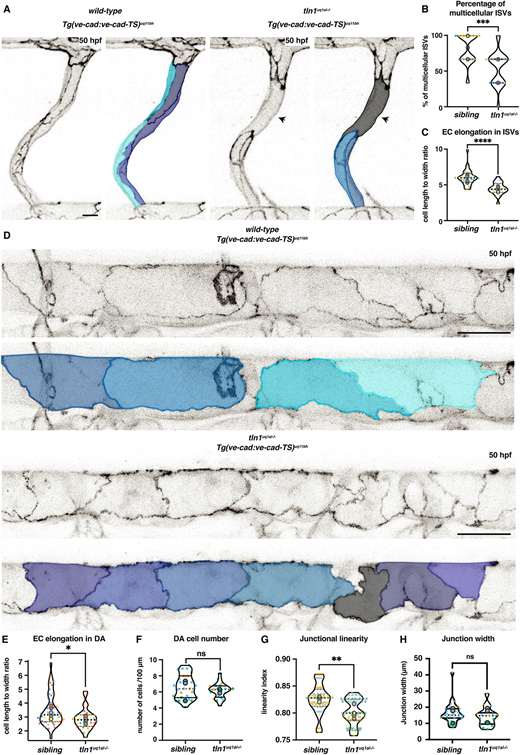
Fig. 3
Loss of focal adhesions impairs endothelial cell remodelling. (A) Single ISVs of a wild-type sibling and in tln1uq1al−/− mutant embryo at 50 hpf, expressing VE-cadherin Tg(ve-cad:ve-cad-TS). False-coloured images indicate EC shapes. Arrowheads indicate a region of the ISV that is unicellular in the mutant. Scale bar: 10 µm. (B) Quantification of the percentage of multicellular ISVs per two somites, n=5 replicates: n=31 siblings and n=22 tln1uq1al−/− mutants (***P<0.001, Mann–Whitney test). (C) Quantification of EC elongation in ISVs, n=5 replicates: n=31 siblings and n=22 tln1uq1al−/− mutants (****P<0.0001, Mann–Whitney test). (D) Dorsal aorta (DA) of a wild-type sibling and a tln1uq1al−/− mutant embryo at 50 hpf, expressing VE-cadherin Tg(ve-cad:ve-cad-TS). False-coloured duplicate images indicate EC shapes. Scale bars: 25 µm. (E) Quantification of EC elongation in the DA, n=6 replicates: n=41 siblings and n=30 tln1uq1al−/− mutants (*P<0.05, Mann–Whitney test). (F) Number of ECs in the DA, quantified over a 100 µm region, n=3 replicates: n=31 sibling ECs and n=17 tln1uq1al−/− mutant ECs, no significant difference (ns) (Mann-Whitney test). (G) Quantification of junctional linearity of ECs in the DA, n=6 replicates: n=20 siblings and n=21 tln1uq1al−/− mutants (**P<0.01, unpaired t-test). (H) Quantification of junction width measured by VE-cadherin-TS expression, n=3 replicates: n=31 siblings and n=16 tln1uq1al−/− mutants, no significant difference (ns) (Mann-Whitney test). In all graphs, replicate averages are depicted by large circles; smaller circles indicate individual data points of each replicate (colour matched).