FIGURE SUMMARY
Title

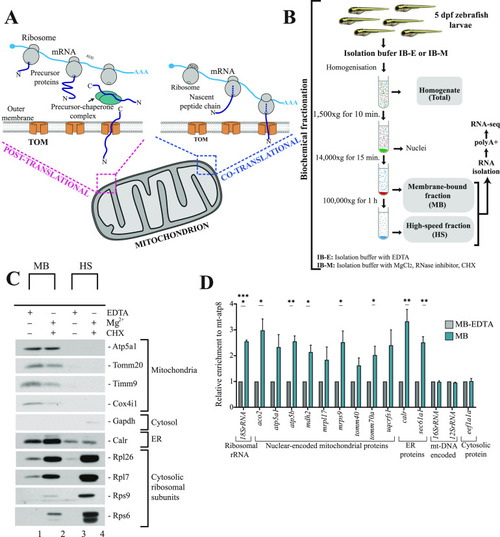
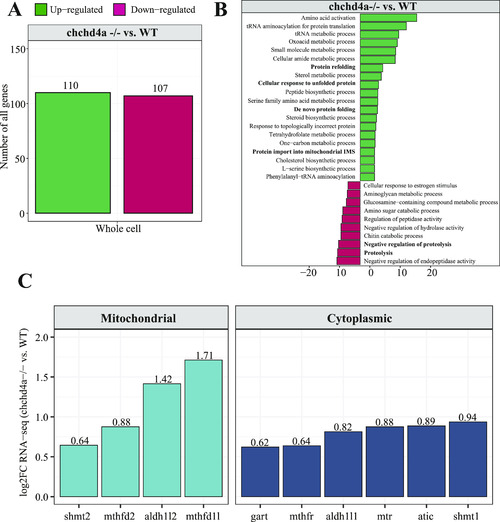
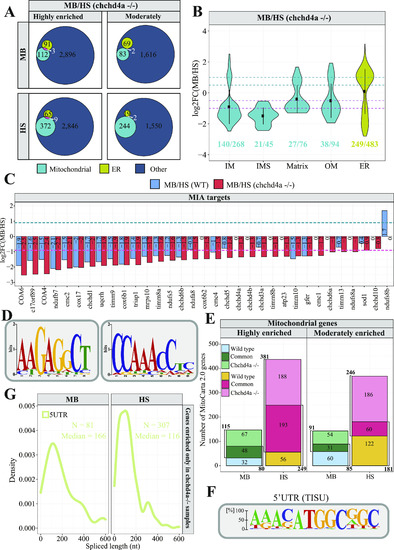
Profiling subcellular localization of nuclear-encoded mitochondrial gene products in zebrafish

Authors
Uszczynska-Ratajczak, B., Sugunan, S., Kwiatkowska, M., Migdal, M., Carbonell-Sala, S., Sokol, A., Winata, C.L., Chacinska, A.
Source
Full text @ Life Sci Alliance

Isolation and identification of membrane associated mRNAs.

(A) Routes for mitochondrial protein import. In post-translational import, proteins are imported to mitochondria after their complete synthesis in the cytosol in a process aided by chaperones and co-chaperones. Whereas the localized translation that occurs at the surface of mitochondria may be directly coupled with the translocation of proteins into organelle. (B) Biochemical fractionation of 5 days post fertilization zebrafish larvae based on strategy to obtain intact mitochondria with associated ribosomes in yeast (Gold et al, 2017). Isolation of mitochondria with associated ribosomes was performed using a ribosome-friendly buffer (IB-M) containing MgCl2, cycloheximide, and RNAse inhibitors. MB and HS fractions were obtained via differential centrifugation. Total RNA isolated from each fraction was enriched for polyadenylated fraction and subjected to short-read sequencing using Illumina platform. (C) Isolation of membrane-bound and high speed fractions. (D) qRT-PCR validation of MB fraction. Relative enrichment of genes in MB with respect to EDTA-stripped MB upon normalization with mitochondrial DNA encoded mt-atp8 is shown. Data derived from three biological replicates. Error bars correspond to SEM; P < 0.05 (*), P < 0.01 (**), and P < 0.0001 (****) by unpaired t test.

Subcellular localization of nuclear-encoded mitochondrial mRNAs.

(A) Bar plots representing the total number of genes identified in MB and HS fractions obtained via biochemical fractionation of WT 5 dpf zebrafish samples and short-read Illumina RNA sequencing. (B) Gene Ontology (GO) enrichment for highly enriched genes in MB (2,177) and HS (3,315) fractions using biological process aspect. The results are shown as a negative log10P-value after Bonferroni correction. Bars in green indicate GO terms enriched for genes detected in MB fraction, whereas the purple bars represent the GO terms for the features identified in HS. For better representation of the results the bars enriched for genes in HS were transformed to be located on the left hand side of the plot. (C) Venn diagrams representing the number of mitochondrial genes from the merged MitoCarta 2.0 (Calvo et al, 2016) and IMPI repository, as well as the zebrafish orthologues of human 483 genes encoding proteins that localize to ER according to the Human Protein Atlas, identified in MB or HS fraction from WT samples. (D) Violin plot showing the distribution of log2 gene enrichments for genes grouped by their location within mitochondria. (E) ER genes were also included in this analysis (E) Bar plots showing the log2 gene enrichments of yeast (blue) and human (yellow) orthologous genes for which transcripts were reported to be translated by the mitochondrion-bound or free cytosolic polysomes.

Properties of membrane-associated transcripts.

(A, B, C) Analysis of gene enrichment of (A) the ATP-binding cassette transporters, (B) solute carriers, (C) mitochondrial pyruvate carrier, and the sideroflexin carriers. The purple dashed line represents log2FC = −1 and the green dashed line represents log2FC = 1. (D) Length distribution analysis of coding sequences and UTR regions for transcripts encoding mitochondrial (cyan), ER (green), and other proteins (navy). (E) Boxplots showing PhastCons (Siepel et al, 2005) conservation tracks for gene categories described above. PhastCons score equal to 1 represents highly conserved sequences, whereas PhastCons score equal to 0 indicates rapidly evolving sequences. (F) Bar plot representing proportion of transcripts encoding mitochondrial, ER and other proteins with transmembrane domains. (G) The numbers in parenthesis indicate the numbers used to calculate proportions (G) The sequence logo illustrating motif enriched in 3′UTR regions of MB fraction-enriched transcripts encoding mitochondrial proteins.

Experimental validation of computationally predicted gene enrichments.

(A) Bar plot showing the log2 gene enrichments for the MB fraction-enriched MitoCarta 2.0 genes detected as highly and moderately enriched. (B) qRT-PCR validation of MB fraction-enriched MitoCarta 2.0 genes. (C) Log2 gene enrichments for the HS fraction-enriched MitoCarta 2.0 genes encoding mitochondrial ribosomal proteins, Mia40 substrates and TA proteins. (D) qRT-PCR validation of genes enriched in the HS fraction. Relative enrichment of genes in MB with respect to HS upon normalization with ERCC-00096 is shown. Data derived from three biological replicates. Error bars correspond to SEM; P < 0.05 (*), P < 0.01 (**), P < 0.001 (***), and P < 0.0001 (****) by unpaired t test. (E) Fluorescent in-situ hybridization of selected candidates by RNAscope on whole mount 5 days post fertilization zebrafish larvae. mRNAs are probed by specific RNAscope probes (red) and mitochondria are stained with anti-GFP antibody (green). Yellow in the merged image indicates co-localization of mRNAs on MLS-EGFP tagged mitochondria. Scale = 5 μm. (F) Analysis of co-localization of MB fraction-enriched MitoCarta 2.0 mRNAs with mitochondria. M1 indicates Mander’s co-localization co-efficient of mRNA fraction co-localized on mitochondria harboring MLS-EGFP. The difference between myod1 negative control and mRNA candidates were analyzed by unpaired t test. Error bars correspond to SEM and data derived from five region of interests originating from three experiments (n = 5); P < 0.0001 (****).

Transcriptome changes triggered by <italic toggle='yes'>chchd4a</italic><sup><italic toggle='yes'>−/−</italic></sup> mutation.

(A) Numbers of differentially expressed genes between whole unfractionated chchd4a−/− and WT samples. (B) KEGG enrichment analysis for differentially expressed genes for the whole unfractionated samples. (C) Bar plot showing expression changes of one-carbon genes encoding cytoplasmic (dark blue) and mitochondrial enzymes (light blue).

Dynamics of mRNA subcellular localization under mitochondrial protein import deficiency.

(A) Venn diagrams representing the number of mitochondrial genes from the merged MitoCarta 2.0 (Calvo et al, 2016) and IMPI repository, as well as the zebrafish orthologues of human 483 genes encoding proteins that localize to ER according to the Human Protein Atlas in each chchd4a−/− set. (B, C) Violin plot showing the distribution of log2chchd4a−/− gene enrichments for genes grouped by their location within mitochondria, including also ER genes; (C) gene enrichment analysis for MIA substrates in transcriptomic data for WT (blue) and chchd4a−/− (red) 5 days post fertilization samples. The purple dashed line represents log2FC = −1 and the green dashed line represents log2FC = 1. (D) Two sequence logo illustrating motifs detected in 3′UTR regions of MB fraction-enriched transcripts encoding mitochondrial proteins in chchd4a−/− samples identified by STREME software (Bailey, 2021). (E) Venn diagrams depicting the overlap between the genes identified in WT and chchd4a−/− MB and HS fractions, respectively. (F) The sequence logo illustrating TISU element found in the 5′UTR regions of transcripts exclusively enriched in the HS upon chchd4a mutation. (G) Distribution of 5′UTR lengths in which TISU element was detected.

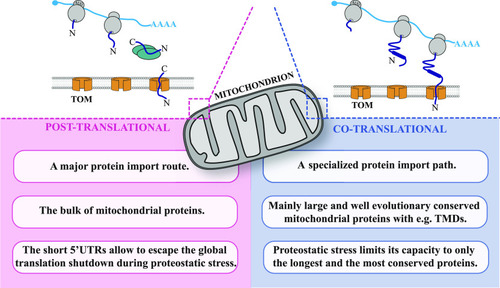
A model describing principles of mitochondrial protein import in zebrafish.

Acknowledgments
This image is the copyrighted work of the attributed author or publisher, and ZFIN has permission only to display this image to its users. Additional permissions should be obtained from the applicable author or publisher of the image. Full text @ Life Sci Alliance