IMAGE

Figure 6.

ID
ZDB-IMAGE-221029-65
Source
Figures for Uszczynska-Ratajczak et al., 2022
Image
Figure Caption

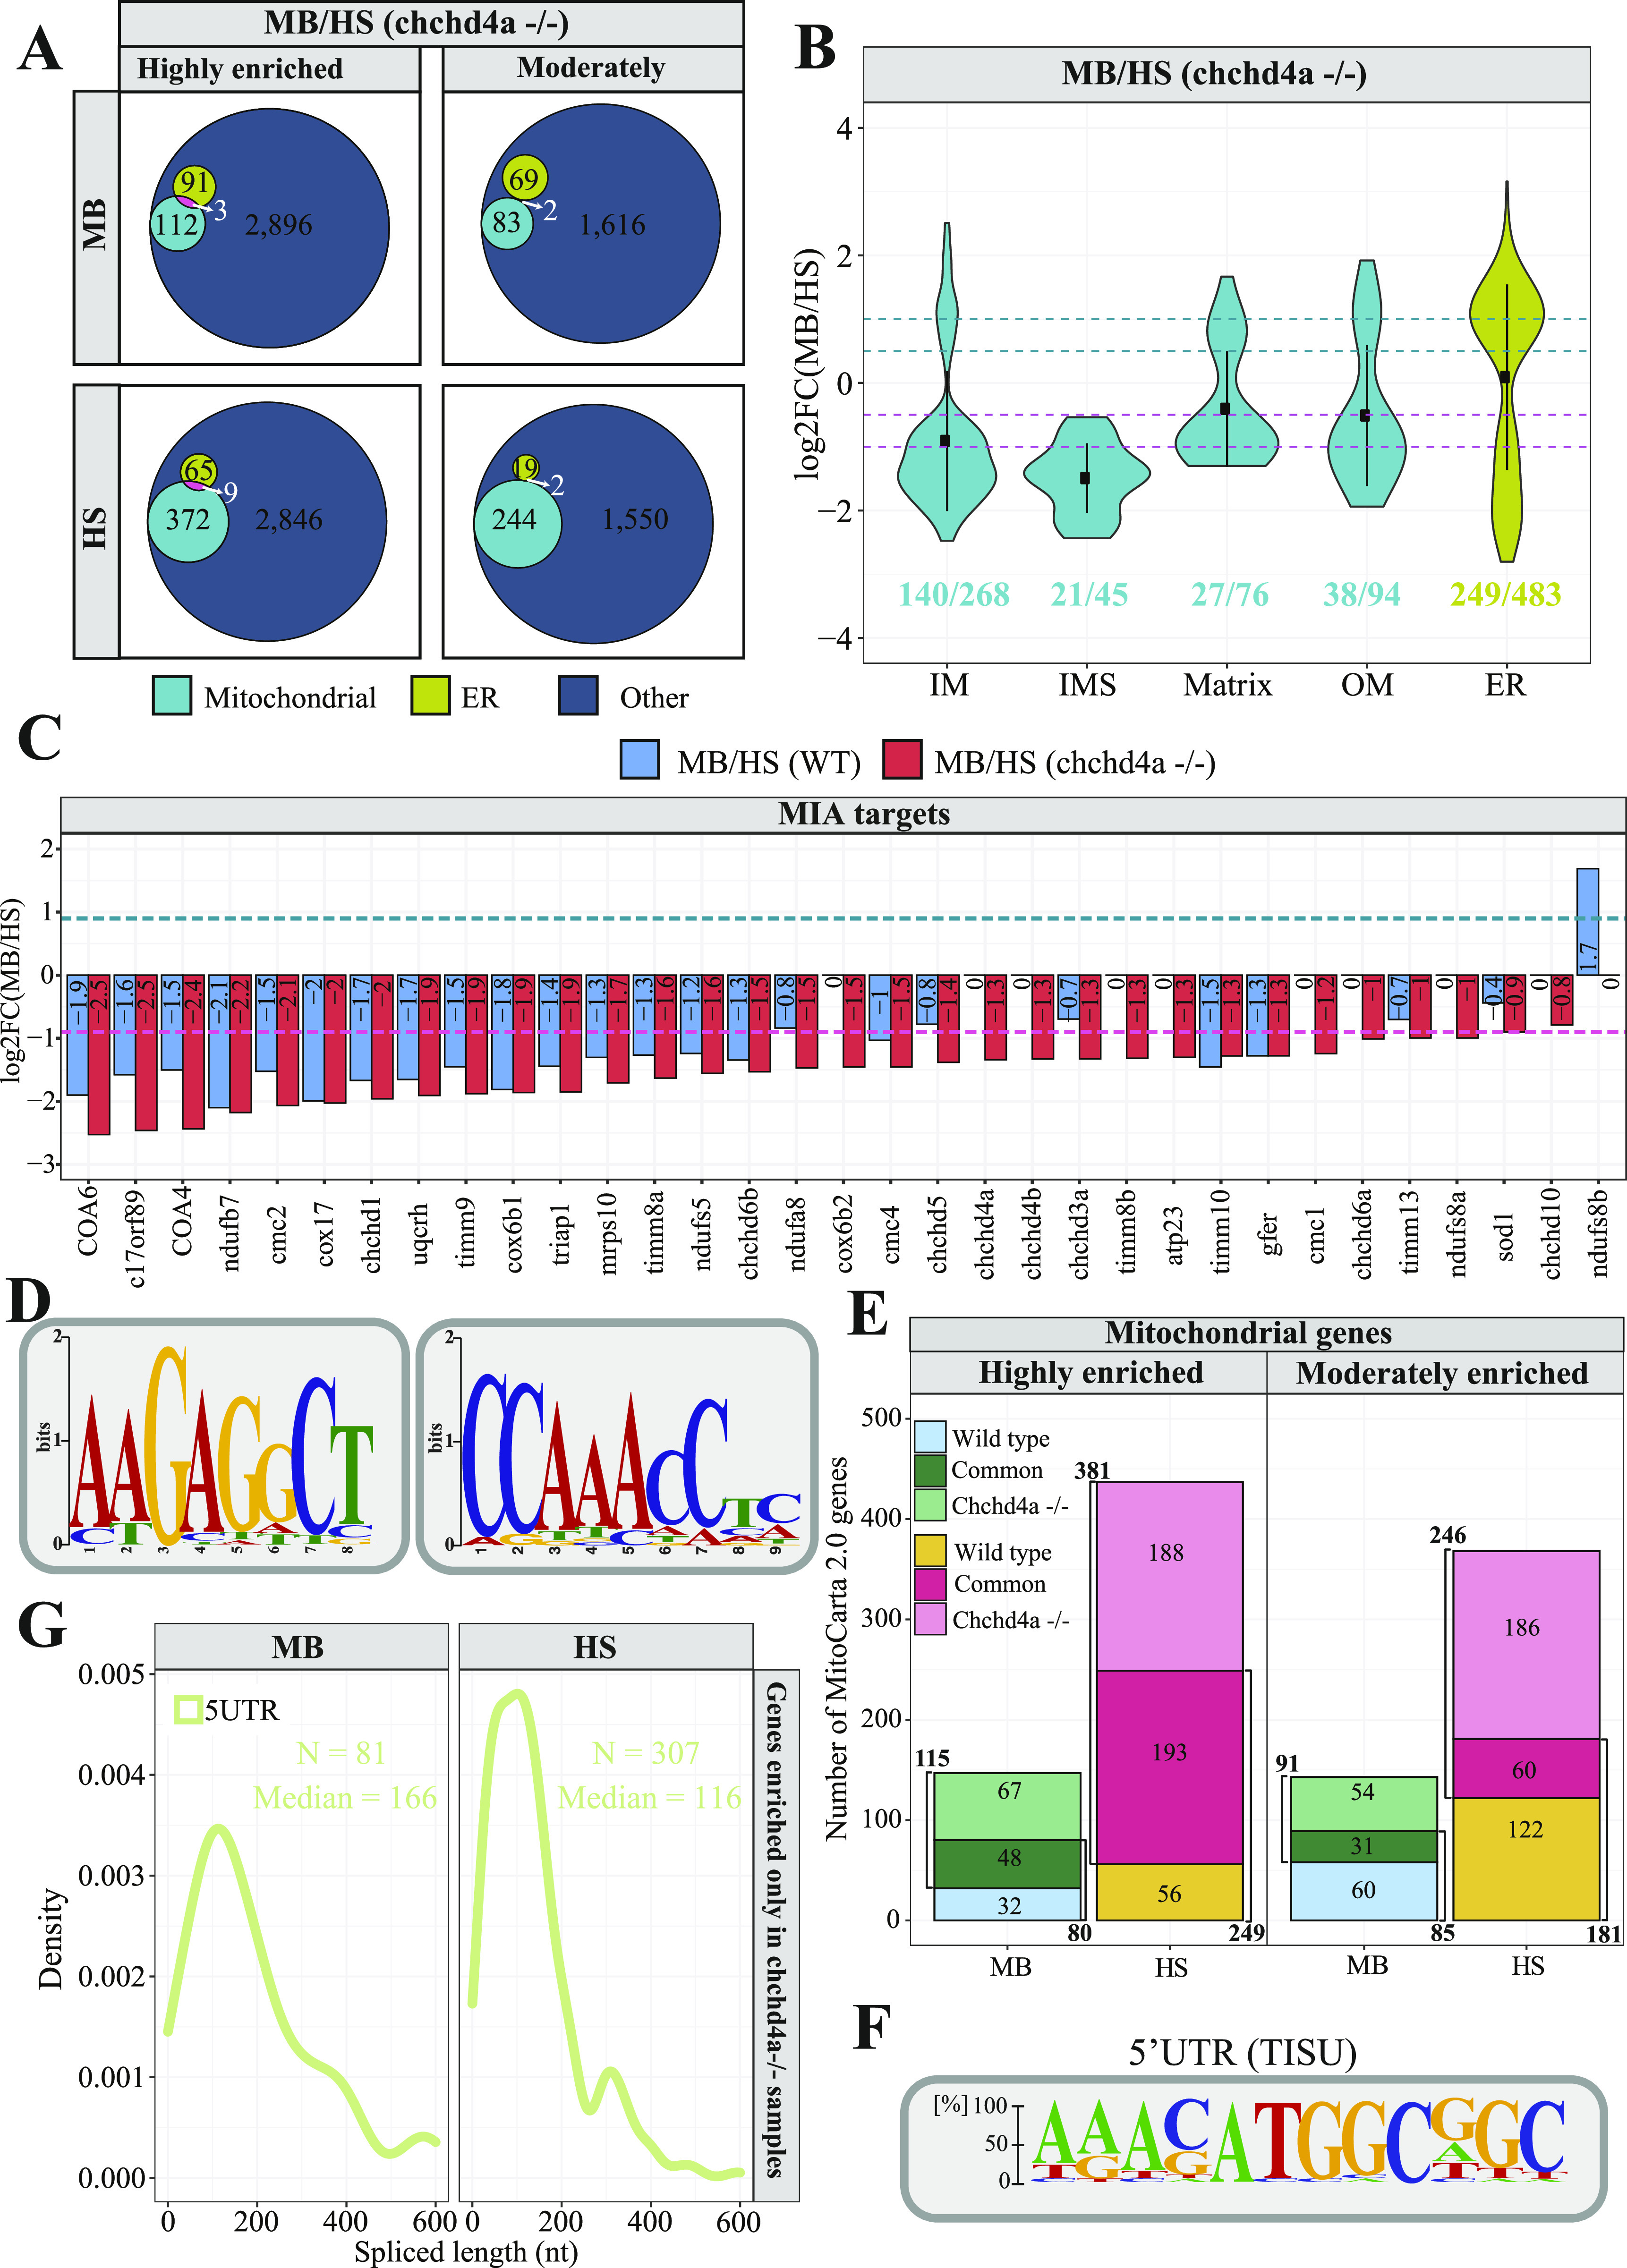
Figure 6. Dynamics of mRNA subcellular localization under mitochondrial protein import deficiency.

(A) Venn diagrams representing the number of mitochondrial genes from the merged MitoCarta 2.0 (Calvo et al, 2016) and IMPI repository, as well as the zebrafish orthologues of human 483 genes encoding proteins that localize to ER according to the Human Protein Atlas in each chchd4a−/− set. (B, C) Violin plot showing the distribution of log2chchd4a−/− gene enrichments for genes grouped by their location within mitochondria, including also ER genes; (C) gene enrichment analysis for MIA substrates in transcriptomic data for WT (blue) and chchd4a−/− (red) 5 days post fertilization samples. The purple dashed line represents log2FC = −1 and the green dashed line represents log2FC = 1. (D) Two sequence logo illustrating motifs detected in 3′UTR regions of MB fraction-enriched transcripts encoding mitochondrial proteins in chchd4a−/− samples identified by STREME software (Bailey, 2021). (E) Venn diagrams depicting the overlap between the genes identified in WT and chchd4a−/− MB and HS fractions, respectively. (F) The sequence logo illustrating TISU element found in the 5′UTR regions of transcripts exclusively enriched in the HS upon chchd4a mutation. (G) Distribution of 5′UTR lengths in which TISU element was detected.

Acknowledgments
This image is the copyrighted work of the attributed author or publisher, and ZFIN has permission only to display this image to its users. Additional permissions should be obtained from the applicable author or publisher of the image. Full text @ Life Sci Alliance