|
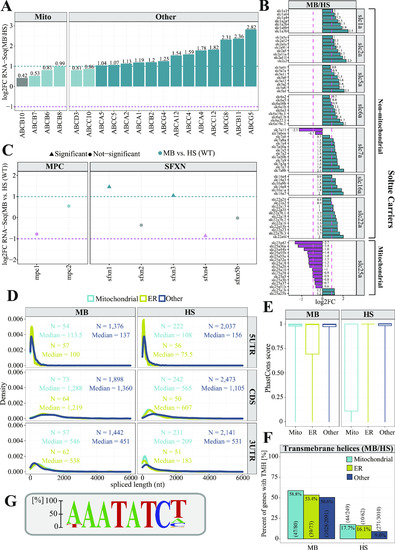
Properties of membrane-associated transcripts.(A, B, C) Analysis of gene enrichment of (A) the ATP-binding cassette transporters, (B) solute carriers, (C) mitochondrial pyruvate carrier, and the sideroflexin carriers. The purple dashed line represents log2FC = −1 and the green dashed line represents log2FC = 1. (D) Length distribution analysis of coding sequences and UTR regions for transcripts encoding mitochondrial (cyan), ER (green), and other proteins (navy). (E) Boxplots showing PhastCons (Siepel et al, 2005) conservation tracks for gene categories described above. PhastCons score equal to 1 represents highly conserved sequences, whereas PhastCons score equal to 0 indicates rapidly evolving sequences. (F) Bar plot representing proportion of transcripts encoding mitochondrial, ER and other proteins with transmembrane domains. (G) The numbers in parenthesis indicate the numbers used to calculate proportions (G) The sequence logo illustrating motif enriched in 3′UTR regions of MB fraction-enriched transcripts encoding mitochondrial proteins.
|