
- Title
-
Metabolite alterations in zebrafish embryos exposed to hydroxylated polybrominated diphenyl ethers
- Authors
- Gustafsson, J., Legradi, J., Lamoree, M.H., Asplund, L., Leonards, P.E.G.
- Source
- Full text @ Sci. Total Environ.
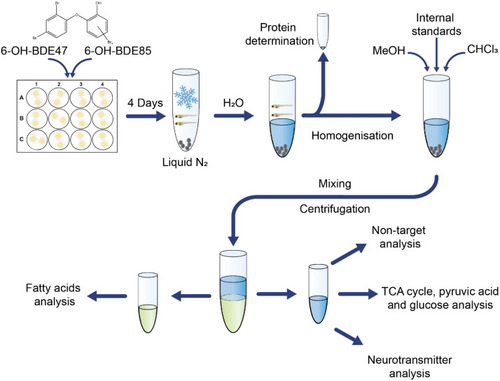
Conceptual illustration of the method. The aqueous phase is shown in blue and the chloroform phase in green. |

Heat map illustrating fold changes of metabolites that were significantly different from the solvent control in at least one exposure. Metabolite names in bold have been annotated at confidence level 1 or 2 and non-bold metabolites have been annotated at confidence level 3. Underlined metabolites have been quantified using authentic reference standards and internal standards. The metabolites are ordered with the significant metabolites for 6-OH-BDE47 0.01 μM on top, followed by the significant metabolites for 6-OH-BDE47 0.1 μM and so on from left to right. Within each exposure group, the metabolites are ordered according to fold change with the highest fold change on top. |

Pathway analysis of A) 6-OH-BDE47 0.1 μM exposure B) OH-PBDE Mix 0.03 μM exposure. Pathways significantly affected (p < 0.05) are labelled with their name. The numerator in the fraction associated with each labelled pathway represents the number of significantly affected metabolites in that particular pathway and the denominator shows the total number of metabolites present in the pathway. The nodes have a continues colour gradient from yellow to red where yellow nodes indicate higher p-value and red nodes indicate lower p-value. A larger size of the node indicates higher pathway impact. |

Metabolic maps for A) 6-OH-BDE47 0.01 μM exposure B) OH-PBDE Mix 0.03 μM exposure. Metabolites are clustered and linked based on known metabolic pathways and chemical similarity using MetaMapp. |
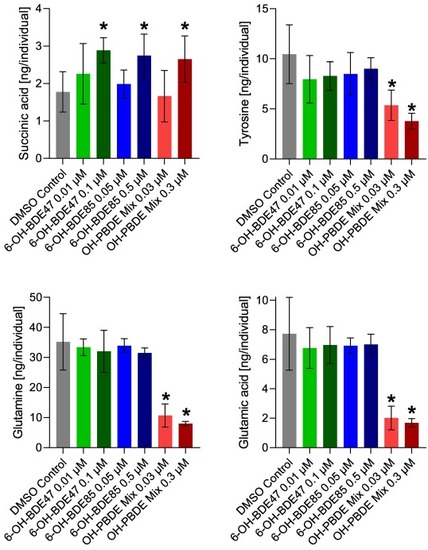
Mean concentration with 95 % confidence interval for succinic acid, tyrosine, glutamine, and glutamic acid. All four metabolites have been measured using LC-MS/MS or GC–MS/MS in MRM mode with authentic reference standards and quantified using isotopically labelled internal standards. Significant (p < 0.05) differences towards the DMSO control are marked with stars. |