
FIGURE
Fig. 5
- ID
- ZDB-FIG-230503-19
- Publication
- Gustafsson et al., 2022 - Metabolite alterations in zebrafish embryos exposed to hydroxylated polybrominated diphenyl ethers
- Other Figures
- All Figure Page
- Back to All Figure Page
Fig. 5
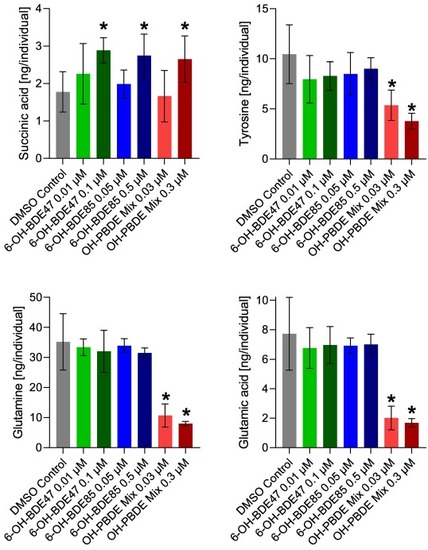
Mean concentration with 95 % confidence interval for succinic acid, tyrosine, glutamine, and glutamic acid. All four metabolites have been measured using LC-MS/MS or GC–MS/MS in MRM mode with authentic reference standards and quantified using isotopically labelled internal standards. Significant (p < 0.05) differences towards the DMSO control are marked with stars. |
Expression Data
Expression Detail
Antibody Labeling
Phenotype Data
Phenotype Detail
Acknowledgments
This image is the copyrighted work of the attributed author or publisher, and
ZFIN has permission only to display this image to its users.
Additional permissions should be obtained from the applicable author or publisher of the image.
Full text @ Sci. Total Environ.